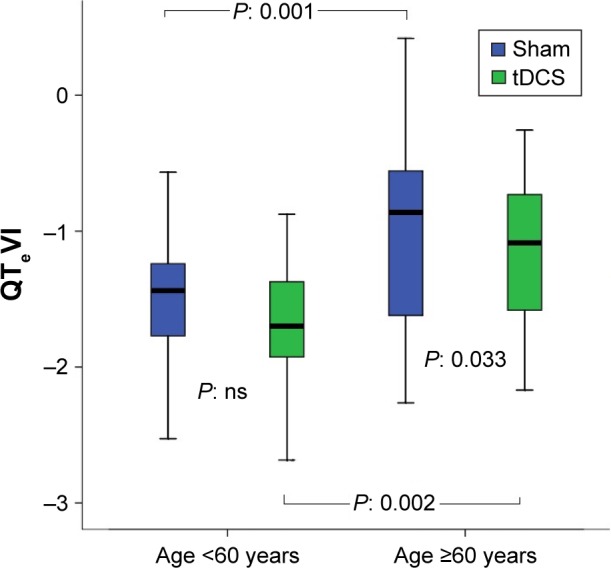
Figure 5.

QTeVI during sham or anodal tDCS in volunteers younger and older than 60 years.
Notes: In the box plots, the central line represents the median distribution. Each box spans from 25th to 75th percentile points, and error bars extend from 10th to 90th percentile points.
Abbreviations: QTeVI, QTe variability index; tDCS, transcranial direct current stimulation; ns, nonsignificant.
