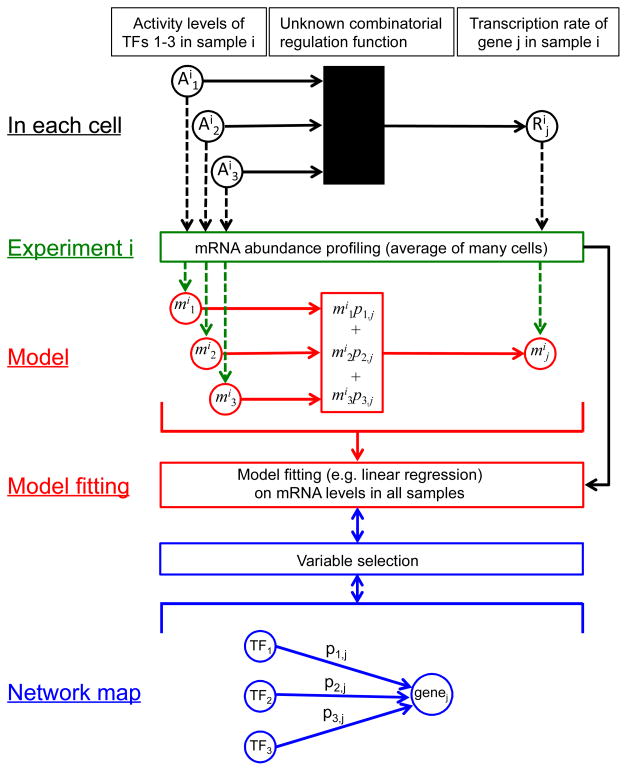
Fig. 1.
Schematic relationship between the true TF network in each cell (black), the experiment typically used to assay the state of the cell (green), a typical linear regression model (red) in which the mRNA abundance of gene j in experiment i (mij) is modeled as a weighted sum of the mRNA abundances of the TFs that regulate it (mi1, mi2, mi3), and a qualitative network map (blue). mRNA abundances serve as proxies for both TF activities and target gene transcription rates. When the goal is to learn the network map, the regression considers all TFs as possible regulators of each gene. After model fitting, the TFs whose mRNA abundances are most predictive of the target gene’s expression level are selected as likely regulators in the qualitative map. When the goal is quantitative modeling and a qualitative map is known in advance, variable selection can feed into model fitting by limiting the potential regulators of each target.

