
Figure 1. Weighted Proportion and 95% Confidence Interval of US Children with Developmental Disabilities aged 6–17 years with Each Adverse Family Financial and Employment Impact and Child Behavioral Functioning Problems, by Functional Limitations Status.
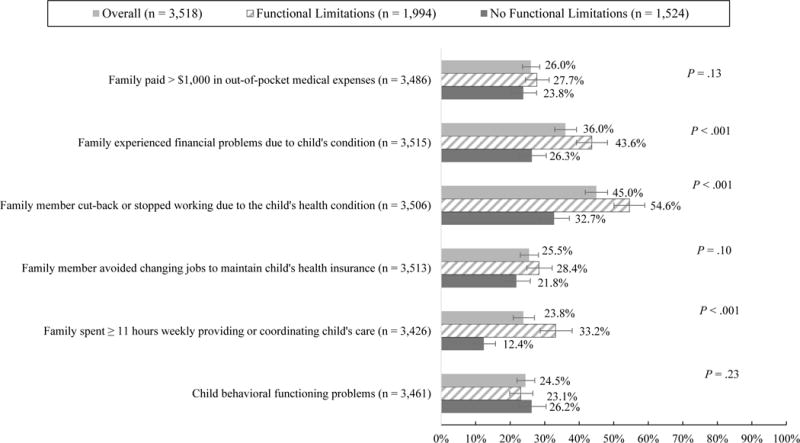
This figure shows the weighted proportion of US children with developmental disabilities aged 6–17 years overall and by functional limitations status that experienced each adverse family financial and employment impact as well as child behavioral functional problems. 95% confidence intervals for each weighted proportion and P-values from weighted chi-square tests comparing the distribution of each variable by functional limitations status are also displayed.
Note: P-values were computed from weighted chi-square tests that compared children with functional limitations to children without functional limitations among the sample of children with developmental disabilities on the variables of interest.
Source: 2011 Survey of Pathways to Diagnosis and Services linked to the 2009–10 National Survey of Children with Special Health Care Needs