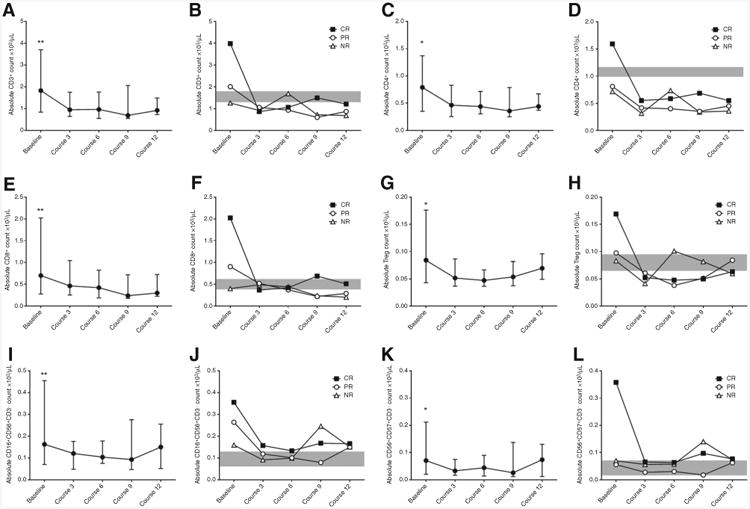
Figure 3.

Number of T and NK cell subset at baseline are higher in patients achieving CR. Treatment with lenalidomide and ofatumumab induced a significant reduction in absolute number of CD3+ T cells compared with baseline levels (A, P always < 0.024), CD4+ T cells (C, P always < 0.021), CD8+ T cells (E, P always < 0.0046), Treg (G, P always < 0.027), CD16+CD56+ NK cells (I, P always < 0.0013), CD57+CD56+ NK cells (K, P always < 0.047). Graphs represent median values and interquartile ranges for each subpopulation at each time point. In panels B, D, F, H, J, and L, patients are divided on the basis of response to treatment, and median values for each subpopulation at every time point are plotted. Gray shade represents the interquartile ranges for HD.
