
Table 4.
Changes in MR Imaging–associated Breast Tumor Heterogeneity Metrics Calculated as Supine Metric Minus Prone Metric in the Six Patients Who Underwent Both Pre- and Postprocedural Intraoperative Breast MR Imaging
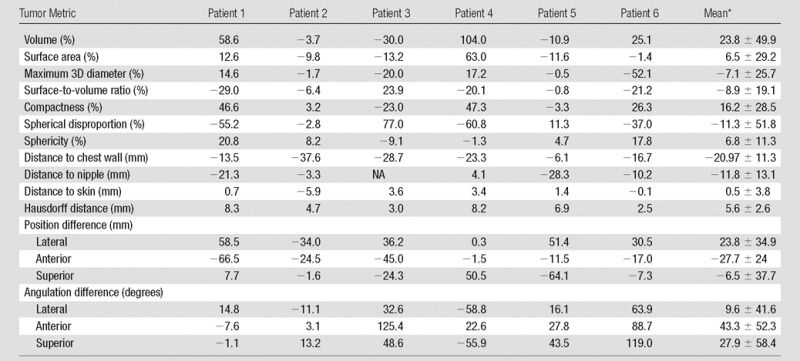
Note.—NA = not applicable.
*Data are mean ± standard deviaton.