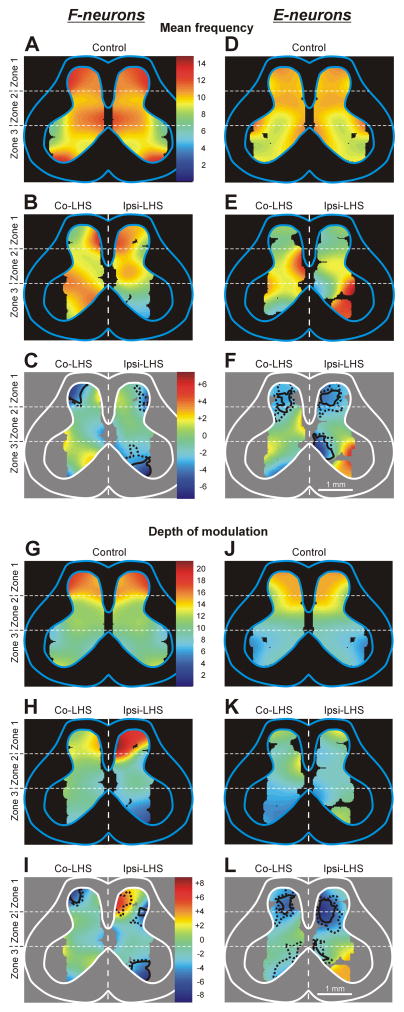
Fig. 6. Effect of Sur-LHS on the mean frequency and the depth of modulation of local populations of F- and E-neurons.
(A,B,D,E) Averaged distributions of the mean frequency of F-neurons (A,B) and E-neurons (D,E) on the cross-section of the spinal cord in rabbits with intact spinal cord (A,D, Control) and in rabbits with LHS (B,E). (G,H,J,K) Averaged distributions of the depth of modulation of local populations of F-neurons (G,H) and E-neurons (J,K) in different areas of the gray matter in animals with intact spinal cord (G,J, Control) and in animals with LHS (H,K). For animals with LHS the distributions on the lesioned side (Ipsi-LHS) and on the intact side (Co-LHS) are shown. The difference between the distributions in LHS animals and in control control animals (subtraction of Control from LHS) is shown for F- and E-neurons in C,I and F,L, respectively. The mean frequency and the depth of modulation values are presented as heatmaps (see Materials and Methods). In C,F and I,L the areas of significant changes of the local mean frequency and the local depth of modulation, respectively, are delimited by a solid line (t-test, P<0.01) and a hatched line (t-test, P<0.05).

