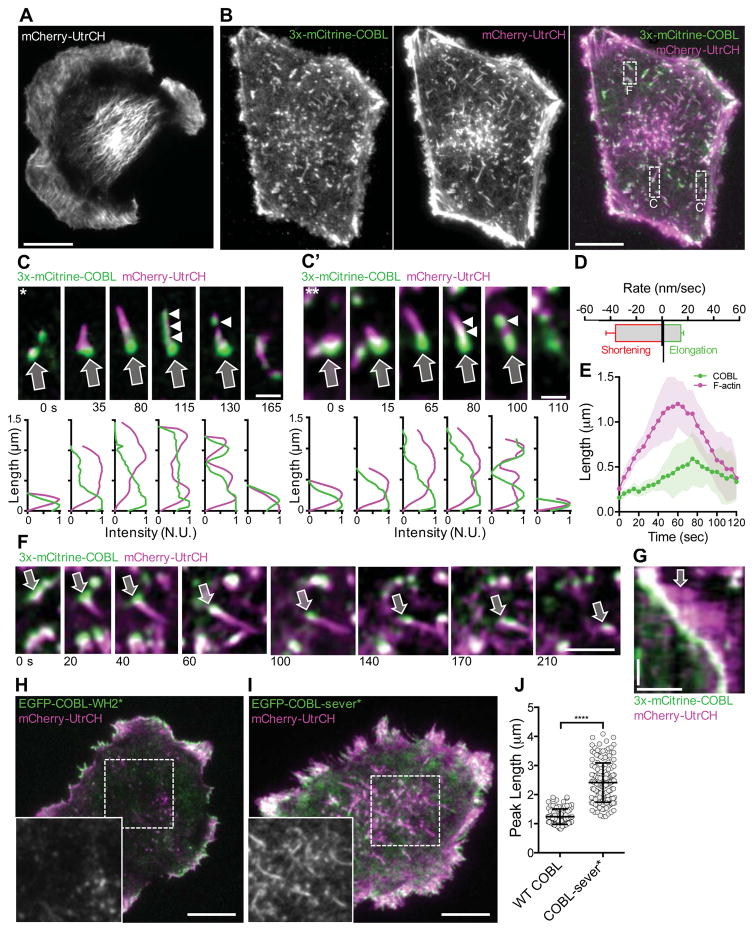
Figure 1. COBL expression induces the formation of linear cytosolic actin structures in B16F1 cells.
Live near-TIRF imaging of a B16F1 cell expressing mCherry-UtrCH alone (A) or 3x-mCitrine-COBL (green) and mCherry-UtrCH (magenta) (B). Scale bar 5 μm. (C & C’) Montages reveal the dynamics of single linear actin structures that form in the dashed boxes in merge image from A. Arrows highlight the initial COBL puncta, arrowheads highlight COBL signal along the structure at later time points. Line scans are shown below each image. Scale bar 1 μm. (D) Rates of assembly and disassembly measured for intracellular actin structures induced by COBL overexpression. n = 42 structures from 10 cells. (E) Graph depicting the ensemble averages of the length of COBL-induced structure (magenta) and the length of the structure occupied by COBL (green) relative to time for ten individual structures ~110–115 sec in duration. Shaded area represents the standard deviation at each time point (F) Montage of a single linear actin structure from the boxed region in (A) that grows and moves through the cytosol before disassembly. Arrow highlights the COBL-associated end of the structure. Scale bar 2 μm. (G) Kymograph of actin structure in (F). Scale bars are 2 μm (horizontal) and 60 seconds (vertical). (H) Near-TIRF image of a B16F1 cell co-expressing EGFP-COBL-WH2* and mCherry-UtrCH. Zoom in lower left-hand corner is of the mCherry-UtrCH channel alone from boxed region. Scale bar is 5 μm. (I) Near-TIRF image of a B16F1 cell co-expressing EGFP-COBL-sever* and mCherry-UtrCH. Zoom in lower left-hand corner is of the mCherry-UtrCH channel alone from boxed region. Scale bar is 5 μm. (J) Graph of peak linear structure length in COBL expressing cells vs. COBL-sever* expressing cells.

