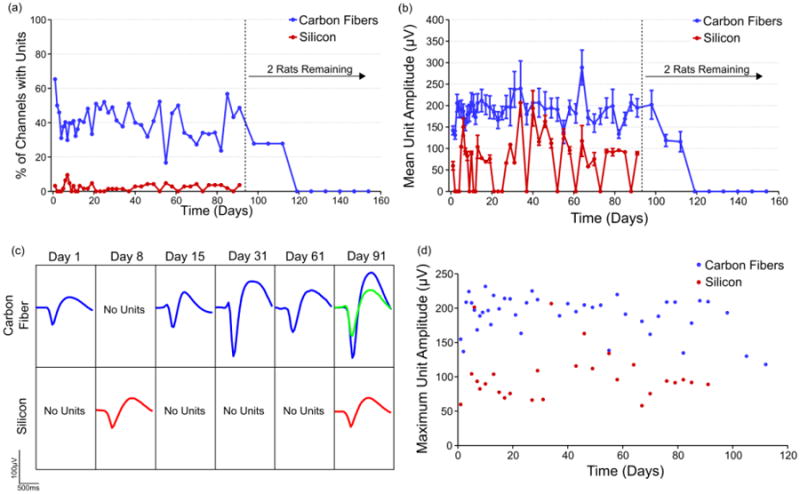
Figure 6. Chronic unit amplitudes and percentage of channels with units.

(a) On average 20% to 40% of viable carbon fiber electrodes detected unit activity across time, while silicon electrodes did so with a peak of 9.5% at day 10 and most other days detecting no unit activity. After day 91 only two rats remained in the study and the loss of their unit activity is likely explained by brain tissue swelling into the craniotomy which was discovered post mortem. The exact number of channels used for calculating the percentage of channels with units at each time point can be seen in figure S2. (b) Carbon fiber electrodes detected an average unit amplitude of 200 μV across three months. Units detected on silicon electrodes had a mean amplitude of 50 – 100 μV. All values are mean ± standard error of the mean. The exact number of units detected and used for amplitude analysis at each time point can be seen in figure S3. (c) Representative time course of detected unit activity on two different channels, one for each electrode type. (d) The mean of the largest unit detected on each carbon fiber or silicon electrode was calculated for each time point.
