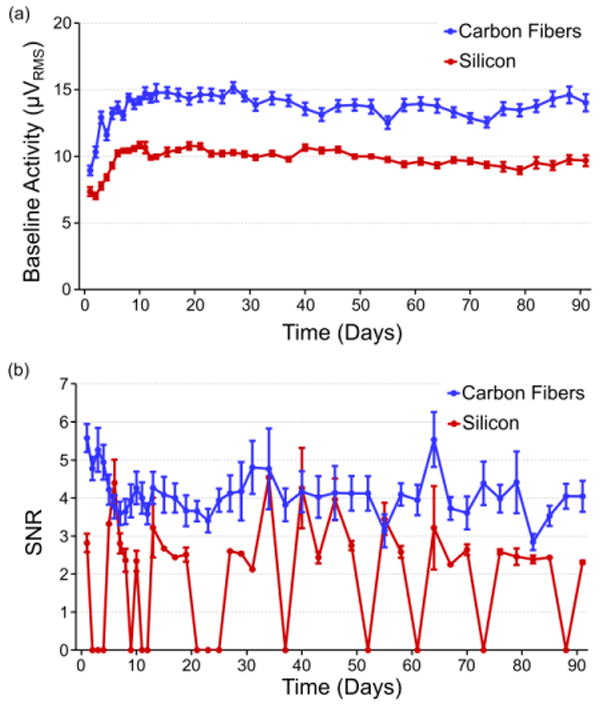
Figure 7. Chronic baseline activity and SNR.

(a) Recorded baseline activity levels (mean ± standard error of the mean) for both carbon fiber and silicon electrodes for the first 91 days. Both baseline trends rise during the first two weeks of recording and then level off to steady state values. Carbon fibers demonstrate a higher overall recorded baseline level than silicon, which can be explained by a larger biological background contribution as evidenced by the high amplitude recordings reported in previous sections. (b) The SNR (mean ± standard error of the mean) for all units detected on the carbon fiber electrodes for the first 91 days. After an initial drop-off within the first week, values level off and hold between 3.5 and 5. The exact number of channels used for calculating the noise levels and SNR at each time point can be seen in figure S2.
