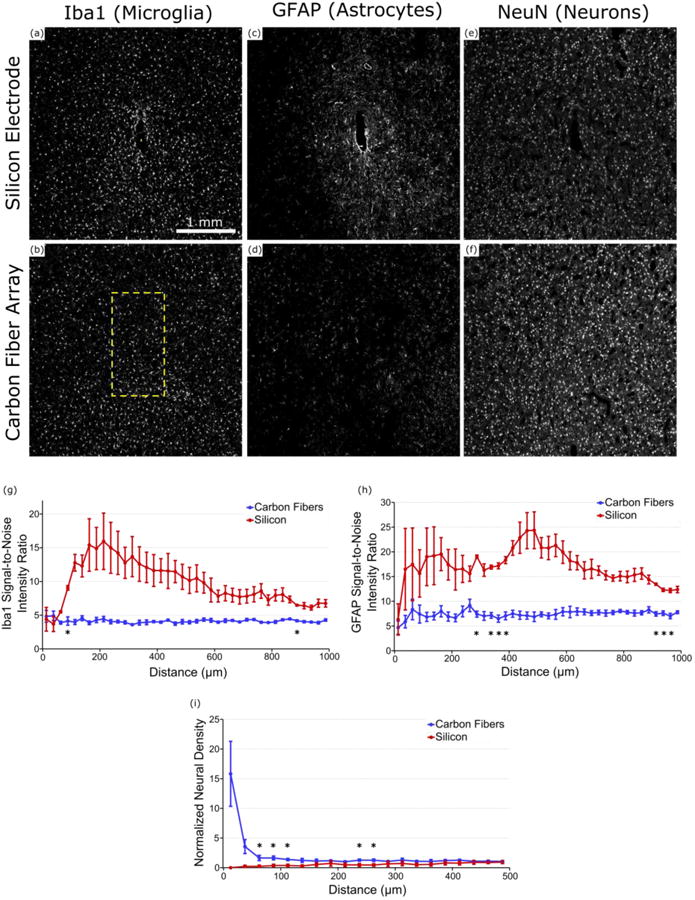
Figure 8. Chronic histology images and analysis.

(a) & (b) Iba1 (microglia) staining around the implanted carbon fiber array and silicon electrode in ZCR19. Formation of a scar is well defined around the silicon electrode but no so around the carbon fiber array. Yellow rectangles show location and approximate size of implanted electrodes. (c) & (d) GFAP (astrocyte) staining around the implanted carbon fiber array and silicon electrode in ZCR19. Increased glial activity can be observed surrounding the silicon electrode with no obvious uptick in activity around the carbon fiber array. (e) & (f) NeuN (neuron) staining around the implanted carbon fiber array and silicon electrode in ZCR19. Neural density appears much more diminished around the silicon electrode as compared to the carbon fiber array. (g) Signal-to-noise intensity ratio of Iba1 staining around each electrode type (n=2 images/electrode type). Compared to the carbon fiber arrays the silicon electrodes maintain a more elevated level of Iba1 activity for almost all distances. (h) Signal intensity analysis of GFAP staining around each electrode type (n=2 images/electrode type). Similar to (g), the silicon electrodes show more GFAP activity as far out as 1000 μm from the implant site. (i) Normalized neural density around each electrode type (n=2 images/electrode type), illustrating the healthy neuronal population surrounding the carbon fiber arrays and a lack of neurons around the silicon electrodes. *indicates significance at p<0.05.
