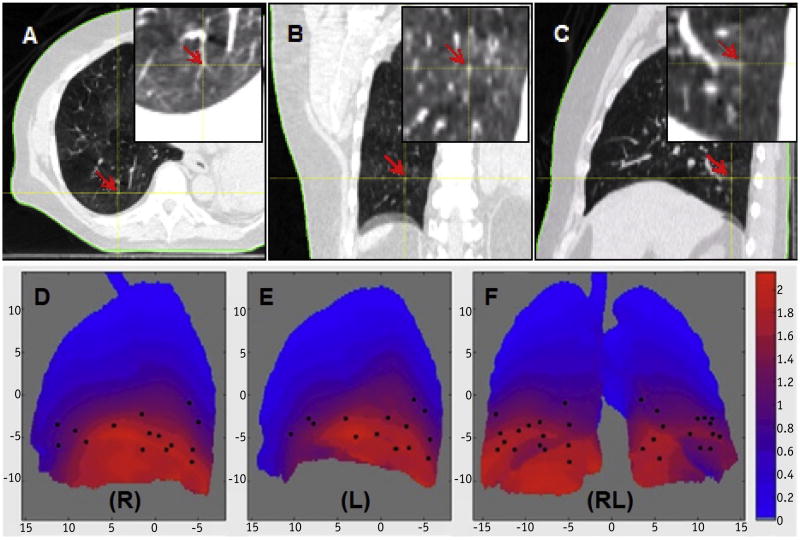
Fig. 1.
Visual determination and verification of a bifurcation point in axial (A), coronal (B), and sagittal (C) views. The coordinates of the point were tracked through 10 breathing phases. The distribution of 30 bifurcation points (black dots) was detected using the automatic bronchial bifurcation array program (D-F). The points are displayed on a heat map of the lung mean motion (red) and the standard deviation (green) in centimeters for each pixel in the projection image. Note that the points are selected based on the image features and spread in the middle-inferior lungs (right [R] and left [L]).

