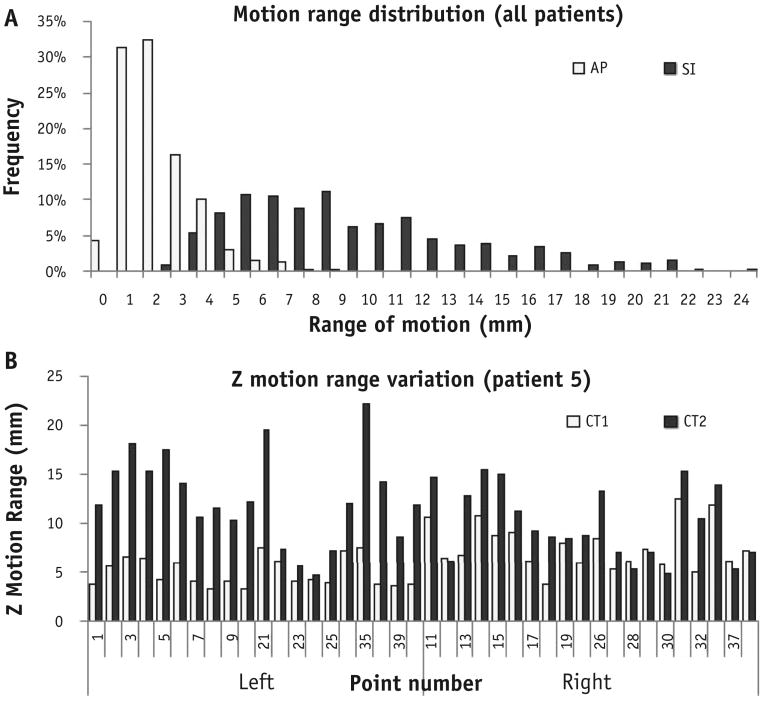
Fig. 2.
(A) Plot of motion range distribution in the superoinferior (SI) and anteroposterior (AP) directions of 800 trajectories (40 points for each patient, 2 sets of 4-dimensional computed tomography [4DCT] scans per patient; 10 patients). The mean motion was 9.4 ± 4.4 mm in the SI direction and 2.7 ± 1.4 mm in the AP direction. (B) Illustration of motion range variation between 4DCT1 and 4DCT2 in patient 5 for 40 points in the SI direction. Significant motion variation is shown across points at different anatomic locations.

