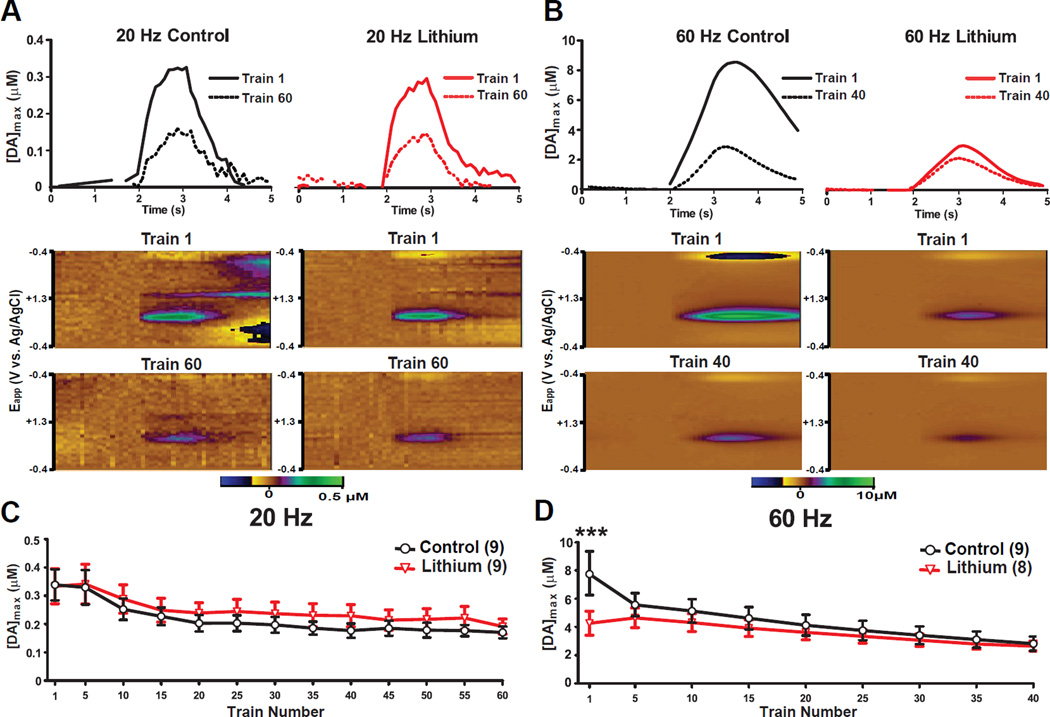
Figure 3. Effects of chronic lithium treatment on repeated electrical stimulation induced depletion of DA.
Stimulation-evoked extracellular DA levels from representative mice that were chronically fed with either 0.4% lithium chloride-containing or control chow following (A) 20 Hz, 500 µA and (B) 60 Hz, 500 µA electrical stimulation of the VTA each 1 sec. in duration. Color plots indicate DA signals represented by the signal in the approximate center (~0.6 V) of the rising phase of the voltage ramp from representative mice. X-Axis: Time (seconds) same as above panels, Y-Axis: Applied potential, Z-Axis (in pseudocolor): DA concentration levels. Peak ([DA]max) levels of electrically evoked DA concentrations during (C) 20 Hz and (D) 60 Hz 500 µA pulse trains. For panels C and D, error bars indicate mean ± SEM. ***p<0.001; n=8–9/group.

