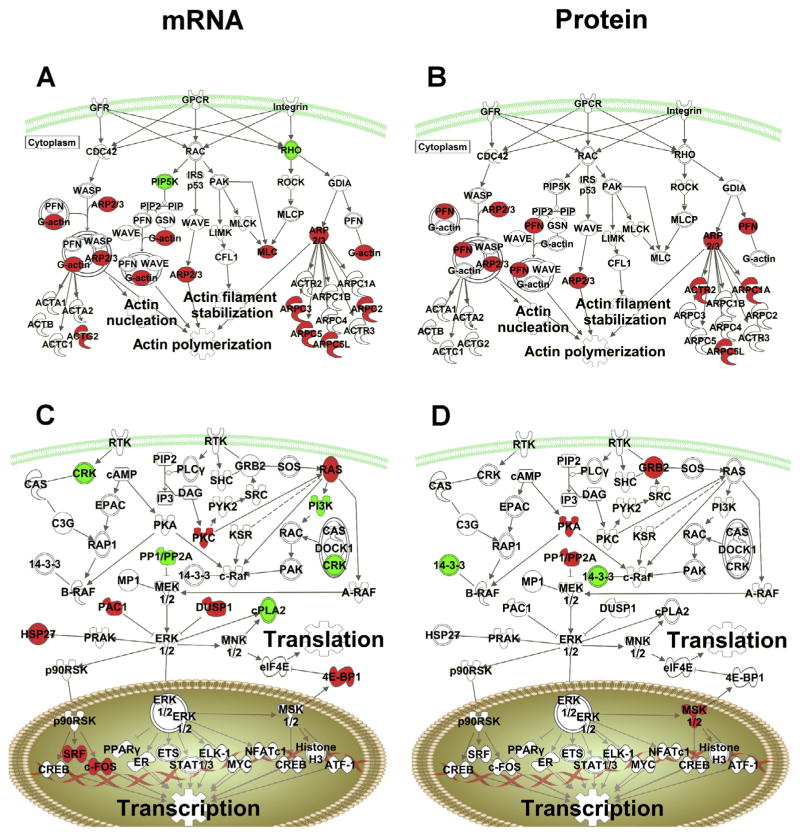
Fig. 7.
Cocaine regulation of specific Canonical Pathways at the mRNA level (left) and protein level (right). (A and B) Comparison of cocaine regulated targets for the Actin pathway. Red denotes upregulation by cocaine and green denotes down-regulation. (C and D) Comparison of regulated targets for the ERK/MAPK signaling pathway by cocaine. (For interpretation of the references to colour in this figure legend, the reader is referred to the web version of this article.)

