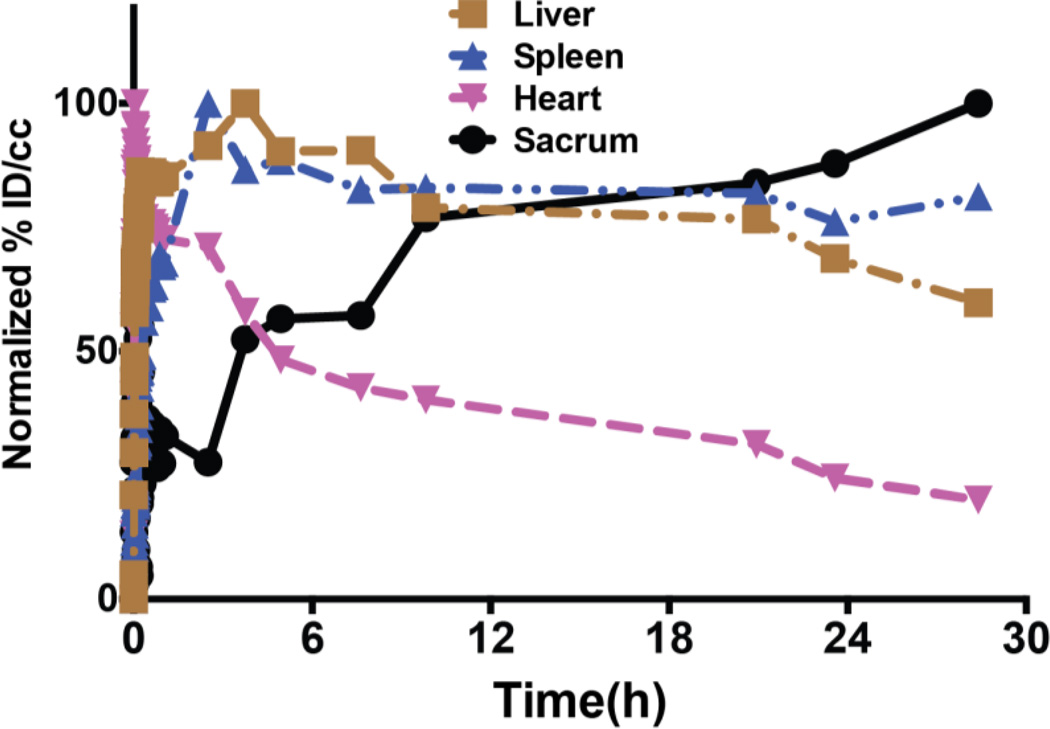
FIGURE 4. Normalized time-activity curves of 90 nm 64Cu-labeled liposome indicating biodistribution profile in mice.
Mice were administered with 64Culipsome via tail vein injection. Time-activity curve was constructed from mean activity concentrations of ROIs drawn around heart, liver, spleen, and sacrum from 1 h dynamic PET scanning image, combined with static PET images of 2.5, 3.7, 5, 7.5, 10, 20, 24, and 28 h. No attenuation correction or partial volume correction was applied.

