
Fig. 1.
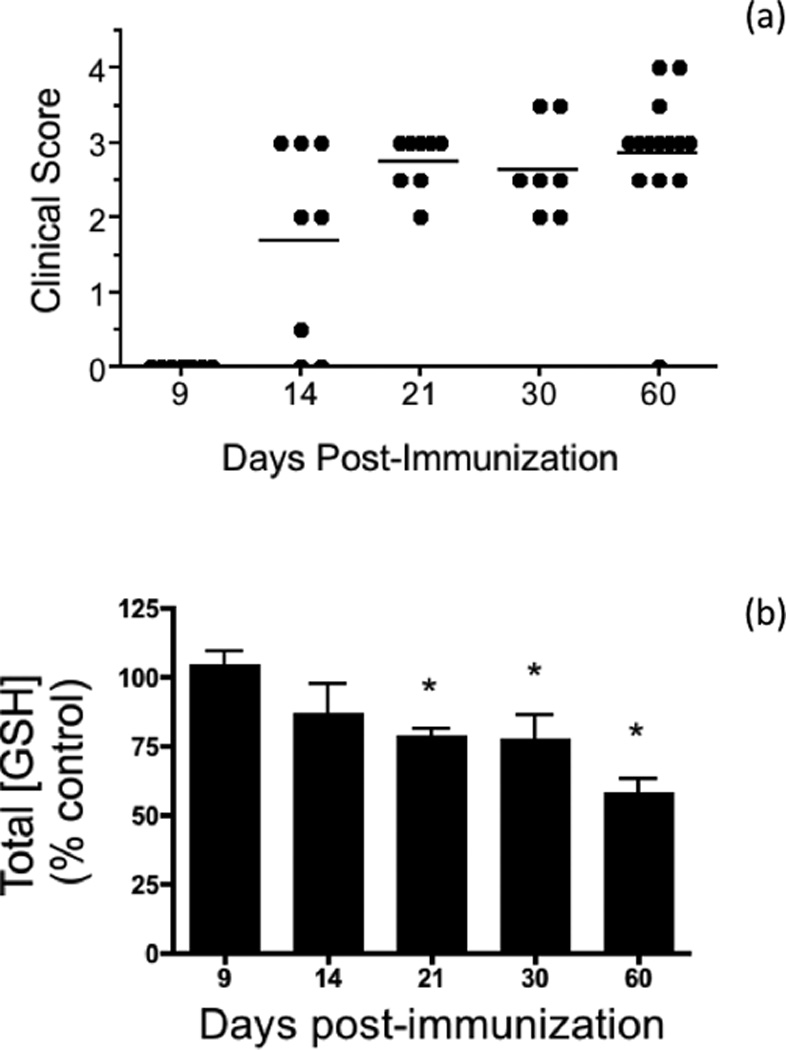
Spinal cord total GSH levels decrease during the course of EAE. (a) Clinical scores of the EAE animals used in this study. EAE was induced in C57BL/6 female mice by active immunization with MOG35–55 peptide in CFA as described under “Materials and Methods”. Animals were monitored daily for signs of clinical disease and scored as indicated in the text. Dots represent the final clinical score of each of the 45 EAE mice used in the study. (b) Relative levels of total GSH in the EAE spinal cord at different times post-immunization. Aliquots of spinal cord homogenates from control and EAE mice were used to determine total GSH levels as described in “Materials and Methods”. Values represent the mean ± SEM of 4–10 animals in each experimental group. Asterisks denote values that are statistically different (p<0.05) from their respective controls.