
Fig. 6.
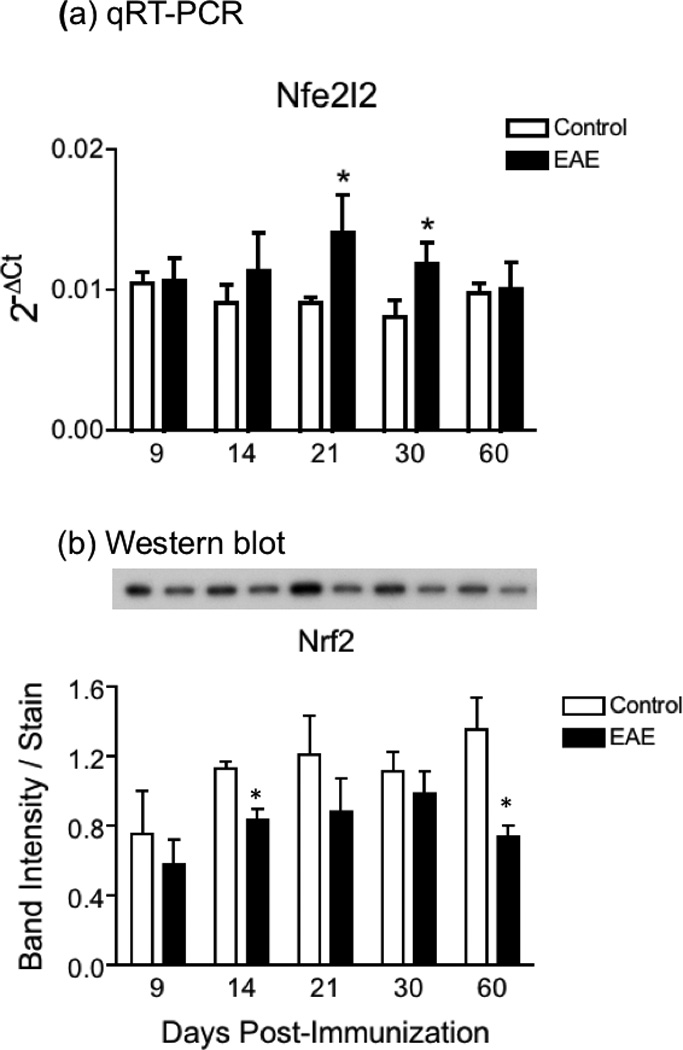
Increased Nrf2 mRNA expression and decreased Nrf2 protein levels in EAE. (a) Nrf2 mRNA levels in the spinal cord of control and EAE mice were determined by qPCR using the primers shown in Table S1 and are expressed relative to the geometric mean of 4 reference genes as described in “Materials and Methods”. Values represent the mean ± SEM of 4–8 animals per experimental group. (b) Nrf2 protein levels in the spinal cord of control and EAE mice were determined by western blot analysis as described under “Materials and Methods”, and were normalized by the amount of coomassie blue stain in the same gel lane. Values represent the mean ± SEM of 3–4 animals per experimental group. Asterisks denote values that are statistically different (p<0.05) from their respective controls. Inset panel shows a representative western blot.