
Fig. 8.
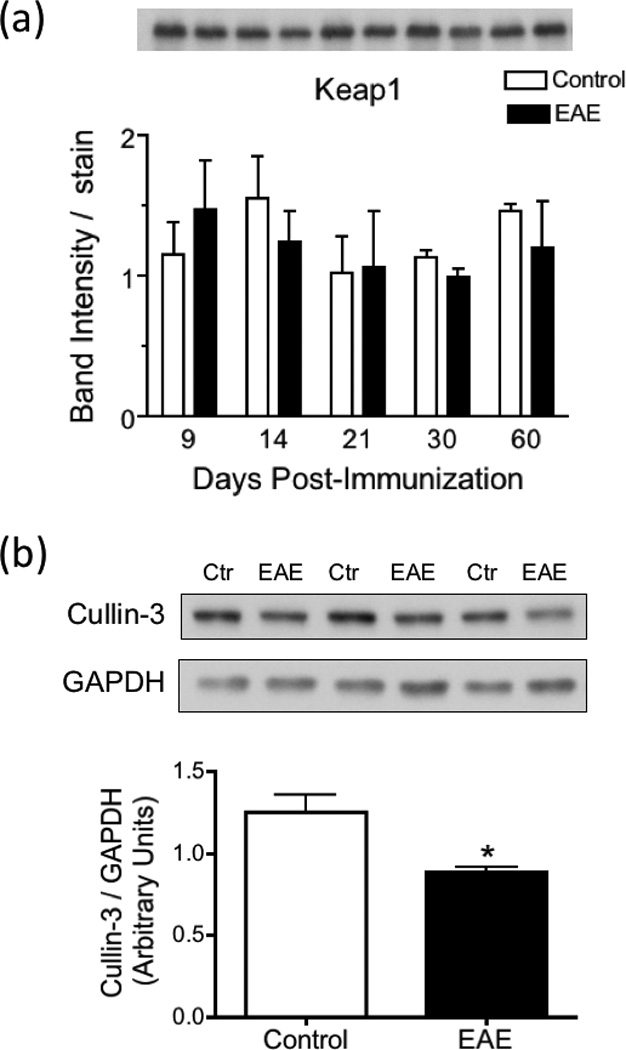
Keap1 levels are unaltered while the concentration of Cullin-3 is decreased in EAE. (a) Keap1 protein levels in the spinal cord of control and EAE mice were determined by western blot analysis as described under “Materials and Methods”, and were normalized by the amount of coomassie blue stain in the same gel lane. Values represent the mean ± SEM of 3 animals per experimental group. Inset panel shows a representative western blot. (b) Cullin-3 levels in the spinal cord of control and EAE mice at 21 dpi were determined by western blot analysis as described under “Materials and Methods” and are expressed relative to those of GAPDH. Values represent the mean ± SEM of 3 animals per group. Asterisks denote values that are statistically different (p<0.05) from control.