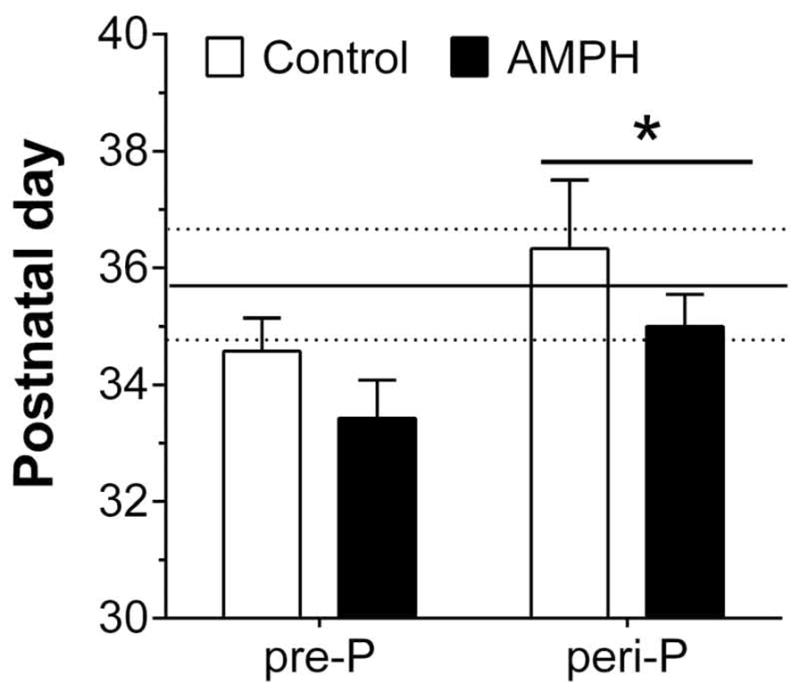
Figure 2.

Puberty onset, as defined by age at vaginal opening, in females (n=5–7/group) given injections of saline (Control) or 3 mg/kg AMPH. The horizontal lines in the figure represent the mean (solid line) and SEM (dotted lines) postnatal day of puberty onset for a separate group of female rats (n = 8) that were otherwise experimentally naïve. *p < 0.05, vs. pre-P collapsed across treatment
