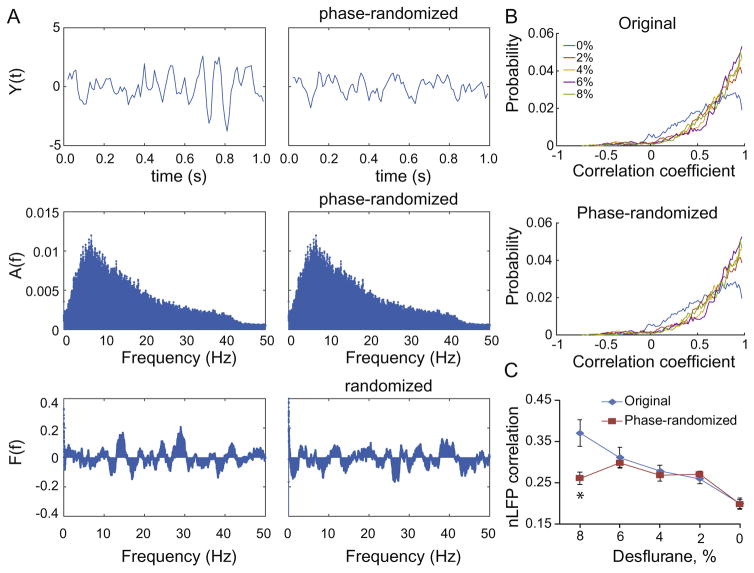
Fig. 4.
Effect of phase-randomization on nLFP correlations. (A) Steps of the analysis. The original signal (top left) is Fourier transformed to yield amplitude spectrum A(f) and phase spectrum F(t). Randomization of the phase at each frequency yields a new phase spectrum (bottom right) while the amplitude spectrum is conserved (middle right). The inverse Fourier transform yields a phase-randomized signal that looks different from the original (top right). The top panels show a short sample of the signal; spectra are from the entire 6-min segment. (B) Probability distribution of all pair-wise correlation coefficients of the LFP signals at five desflurane concentrations from the original and phase-randomized signals. (C) Average cross-correlation of nLFPs from all rats in each state. Original and phase-randomized data differ at 8% desflurane only. *p=0.00066.

