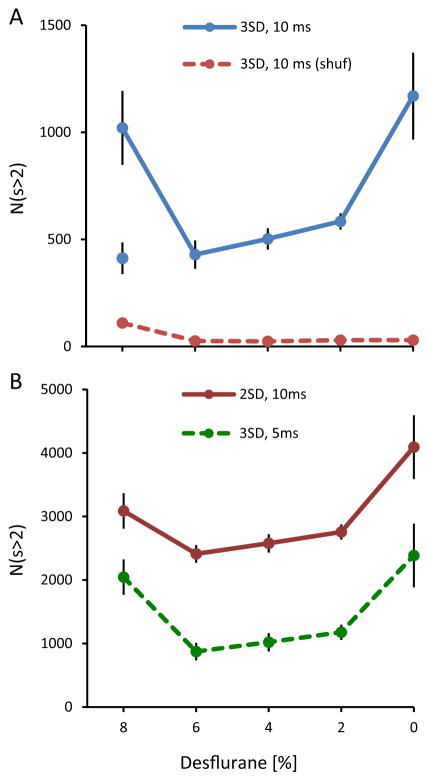
Fig. 5.
Summary statistics of CAPs (size >2) in rat visual cortex. (A) Total number of CAPs shows U-shape dependence on anesthetic depth. The number of CAPs is significantly elevated at 8% and 0% desflurane. *p < 0.05 vs. 6%, 4% and 2% (T-K). Separate, unconnected symbol at 8% shows data from four animals that show no burst-suppression. There is no significant difference among the intermediate levels. (B) Number of CAPs calculated from nLFPs thresholded at different standard deviation (2SD, 3SD) or sampled at different time increments (5 ms, 10 ms). The results are similar to those in panel A.

