Figure 4.
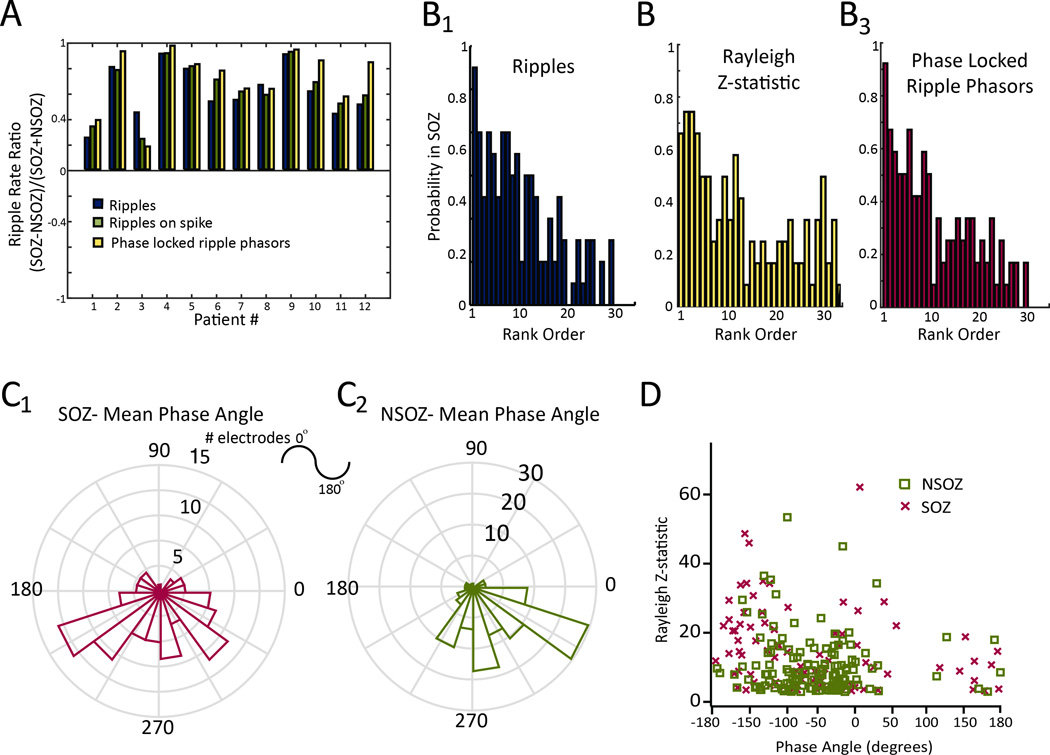
Coupling between epileptiform spike phase and ripple amplitude can be used to identify the seizure onset zone. (A) The ripple rate ratio calculated on the basis of mean event rates measured from electrodes in the seizure onset zone (SOZ), and non-seizure onset zone (NSOZ). Both raw ripples, ripples on spikes, and ripples on spikes transformed to phase locked ripple phasors were overly represented in the SOZ in all 12 patients. Across the 12 patients, the SOZ rate ratio for phase locked ripple phasors (yellow) exceeded the ratio for ripples (blue), and ripples on spikes (student’s paired t-test, n=12, p<0.05). (B) Comparison between rank-ordered total rate of ripple occurrence (B1), rank-ordered Rayleigh Z-statistic for the phase-locked ripple phasors (B2), and rank-ordered of rate of phase-locked ripple phasors (B3) and the probability that a given macroelectrode lay within the SOZ. (C) Polar histogram of the mean phase angle of the ripples on spikes transformed to phase-locked ripple phasors measured in the SOZ (red, C1) and the NSOZ (green, C2). D. Scatter plot of the mean phase angle and Rayleigh Z-statistic of these ripple phasors identified in electrodes in the SOZ (red), and in the (NSOZ).

