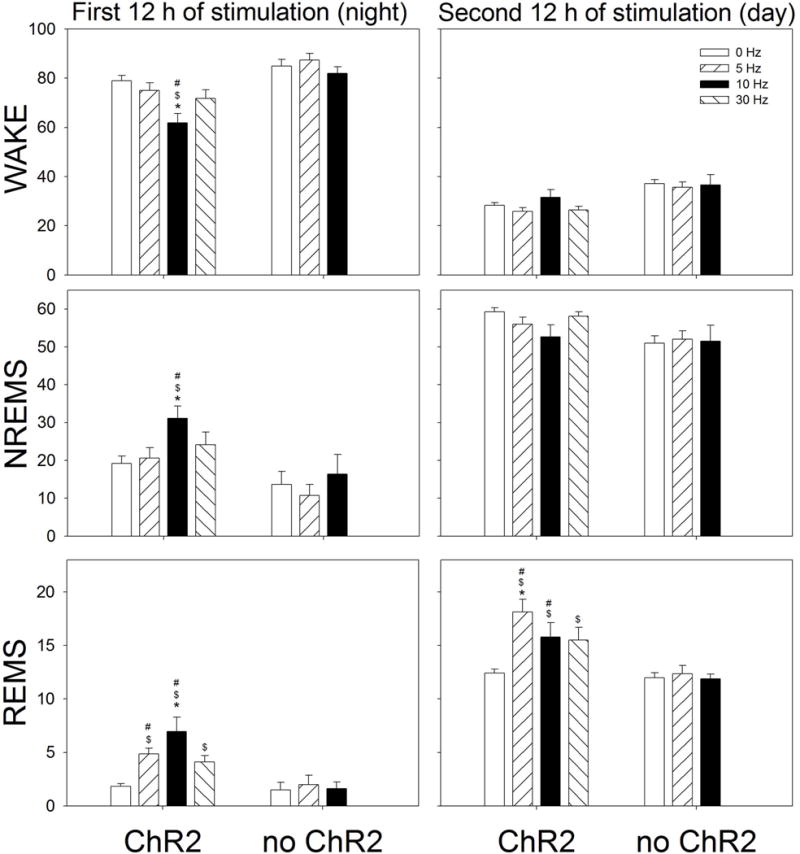
Figure 5.

Effect of optogenetic stimulation of MCH neurons on percent (±SEM) of Wake, NREM sleep and REM sleep. The data summarizes the average percent of wake, NREM sleep and REM sleep during the 12 h period (night or day). Optogenetic stimulation started at lights-off and continued for 24 h (1 min on, 4 min off). *= significance versus 5, 10 or 30Hz within the ChR2 group (p=0.01). $= significance versus 0Hz ChR2 (p<0.02). #= significance versus no ChR2 (p=0.05) (Holm-Sidak post-hoc test after 2-RMANOVA).
