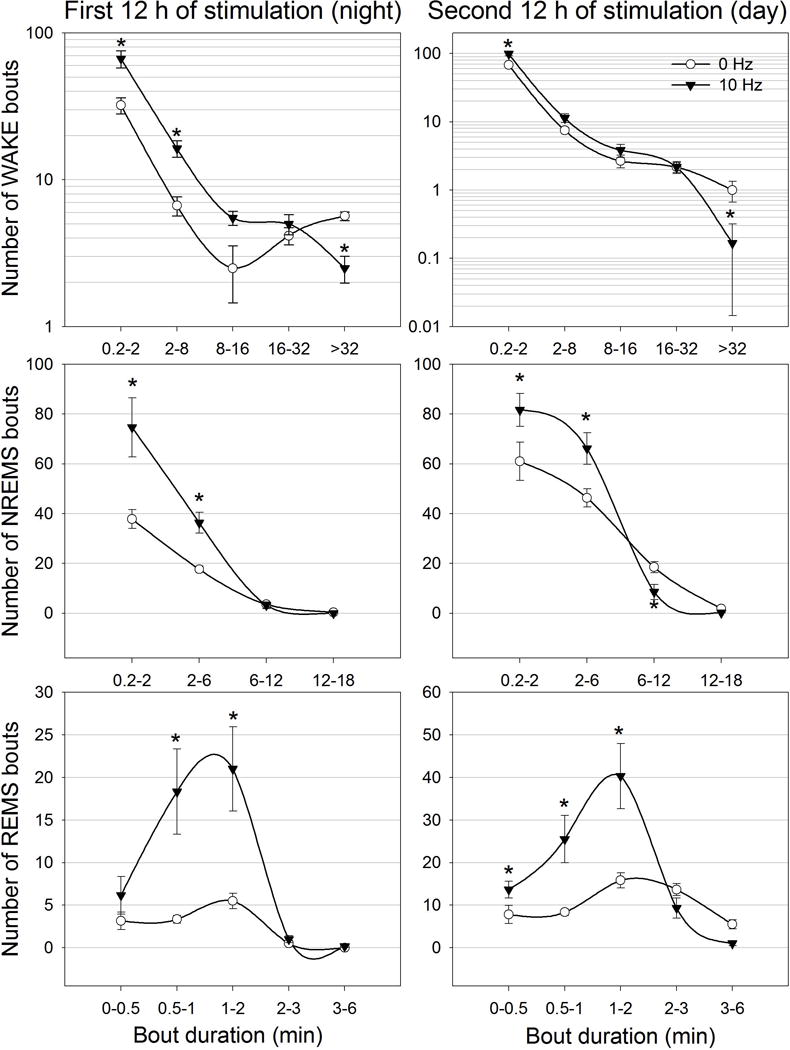
Figure 7.

Effects of 24 h of optogenetic activation of MCH neurons on sleep architecture. The first 12 h of stimulation occurred during the lights-off period whereas the second 12 h occurred during the lights-on period. To better visualize differences between treatments the number of waking bouts are expressed as log10 scale. NREMS and REMS bouts numbers are represented as linear scale. *=significance versus 0 Hz at p=0.01.
