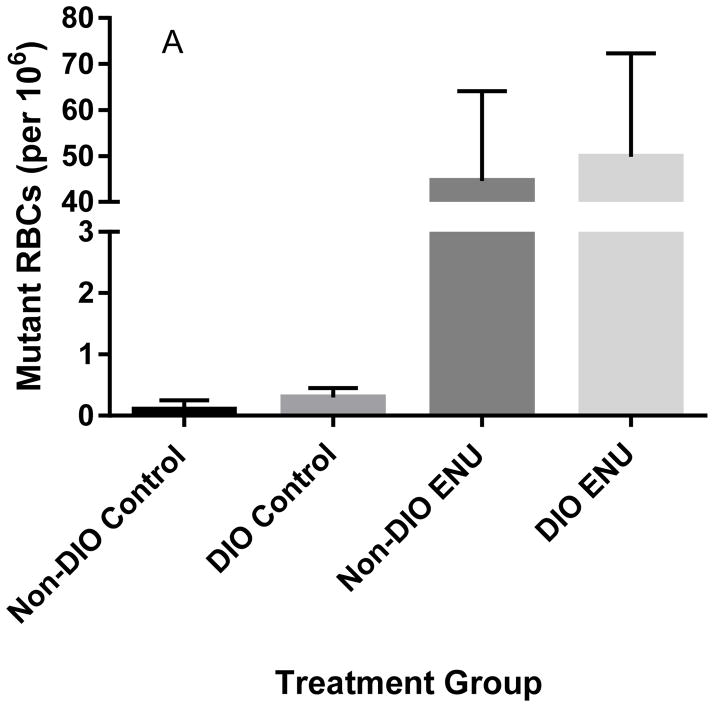
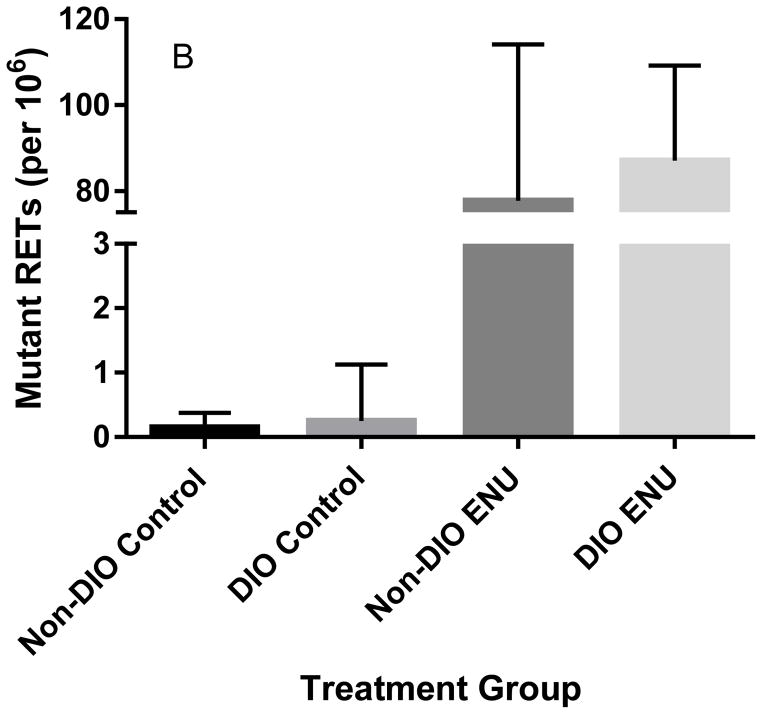
Figure 2.
Frequencies of Pig-a mutant RBCs (A) and RETs (B) in untreated mice on either a normal-fat diet (Non-DIO) or a high-fat diet (DIO) compared to ENU-treated (120 mg/kg/3 days) mice on their respective diets in Experimental Group 1 mice. Mutant RBCs and RETs are significantly higher in ENU-treated mice. Presented as median ± interquartile range.


