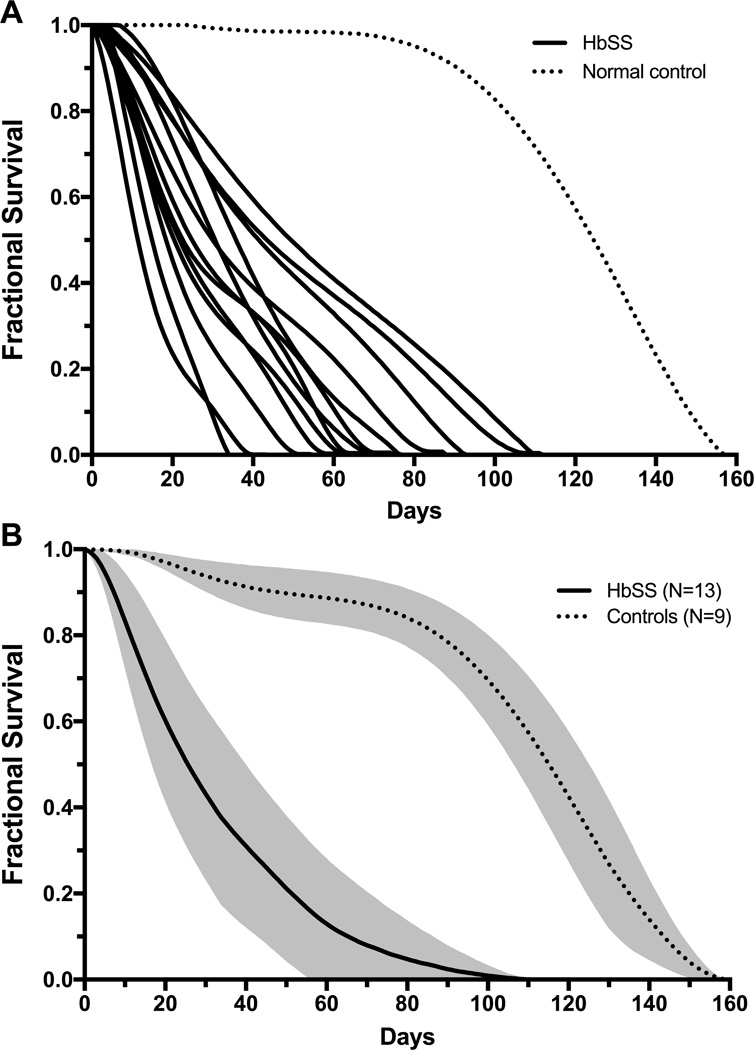
Figure 1. RBC survival curves.
Panel A shows individual RBC survival curves for HbSS patients (solid lines; N=13) and a representative control with normal hemoglobin composition (dotted line) from a prior study.15 Panel B shows a composite RBC survival curve for HbSS patients (solid line, N=13) and controls with normal hemoglobin composition (dotted line, N=9). Mean fractional RBC survival is indicated by the line, and the shaded region depicts ± 1 standard deviation for mean fractional survival.

