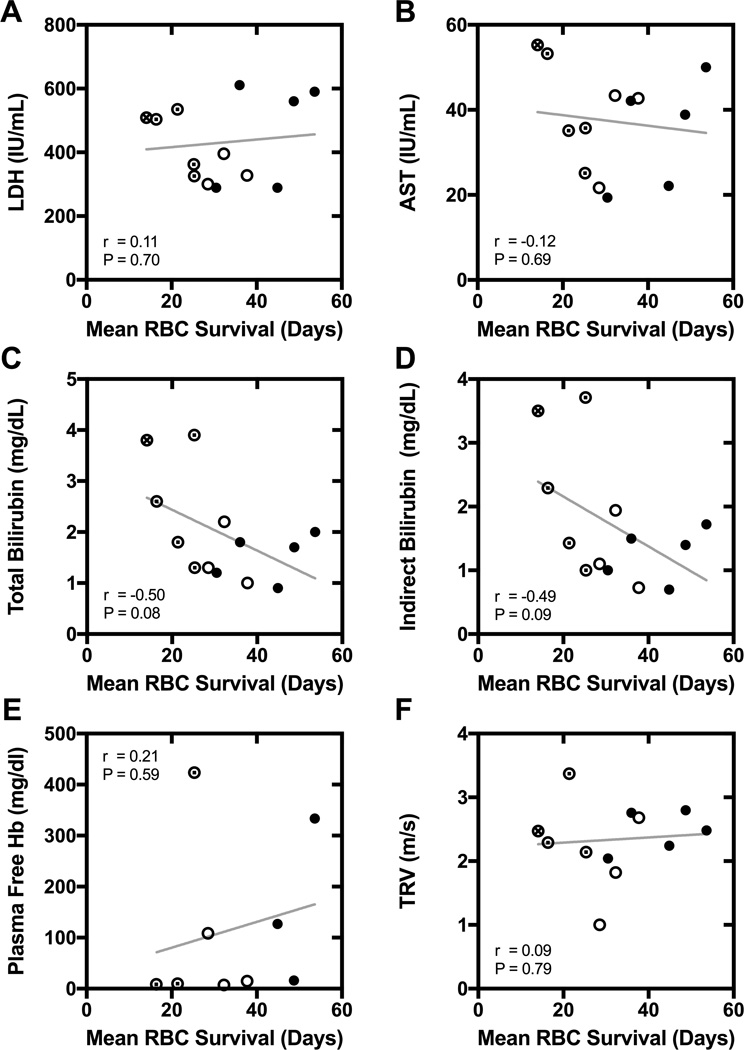
Figure 3. Correlation of mean RBC survival with biochemical surrogate markers of hemolysis and tricuspid jet regurgitant velocity (TRV).
Panel A: lactate dehydrogenase (LDH). Panel B: aspartate aminotransferase (AST). Panel C: total bilirubin. Panel D: indirect bilirubin. Panel E: plasma free hemoglobin (Hb). Panel F: TRV. For each panel, the r and P-value for Pearson correlation are specified, and a linear regression line is shown. The α-globin genotype is also indicated for each participant (● αα/αα;⊙ αα/–α; ○ –α/–α; ⊗ genotype not available).

