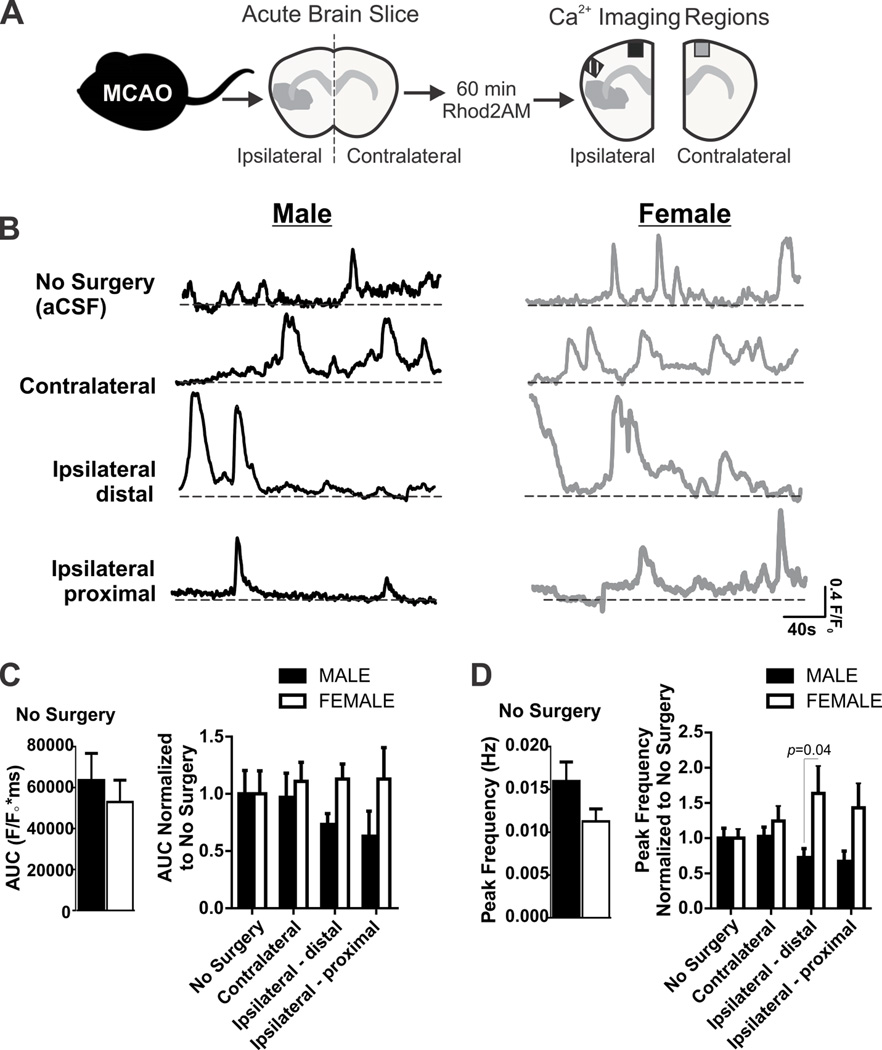
Figure 1. Astrocyte Ca2+ elevations in male and female mice after 60 min MCA occlusion.
A) Experimental protocol for ex vivo Ca2+ imaging of acute brain slices after 60 min MCA occlusion. B) Representative Ca2+ traces acquired from male and female mice: no surgery (aCSF), contralateral, distal ipsilateral and proximal ipsilateral brain regions. C) Summary data of area under the curve (AUC) from Ca2+ traces acquired from spontaneously active astrocytes in male and female brain slices without surgery (left) and after 60 min MCA occlusion (right). N (male/female animals): No surgery (11/10), contralateral (16/11), distal ipsilateral (7/9); and proximal ipsilateral (5/11). AUC in male and female no surgery groups (left, mean and SEM) are compared using unpaired Student’s t-test: p = 0.54. Astrocyte Ca2+ AUC after 60min MCA occlusion (right), are compared using two-way ANOVA (mean and SEM): region: p = 0.89, sex: p = 0.11, interaction: p = 0.68. D) Summary data of Ca2+ peak frequency from spontaneously active astrocytes from male and female brain slices without surgery (left) and after 60 min MCA occlusion (right). N (male/female animals): No surgery (12/10), contralateral (16/12), distal ipsilateral (10/10); and proximal ipsilateral (8/11). Astrocyte Ca2+ peak frequency in male and female no surgery groups (left, mean and SEM) are compared using unpaired Student’s t-test: p = 0.11. Peak frequency after 60min MCA occlusion (right) are compared using two-way ANOVA (mean and SEM): region: p = 0.16, sex: p = 0.005, interaction: p = 0.16 with Sidak multiple comparison analysis reported in figure.

