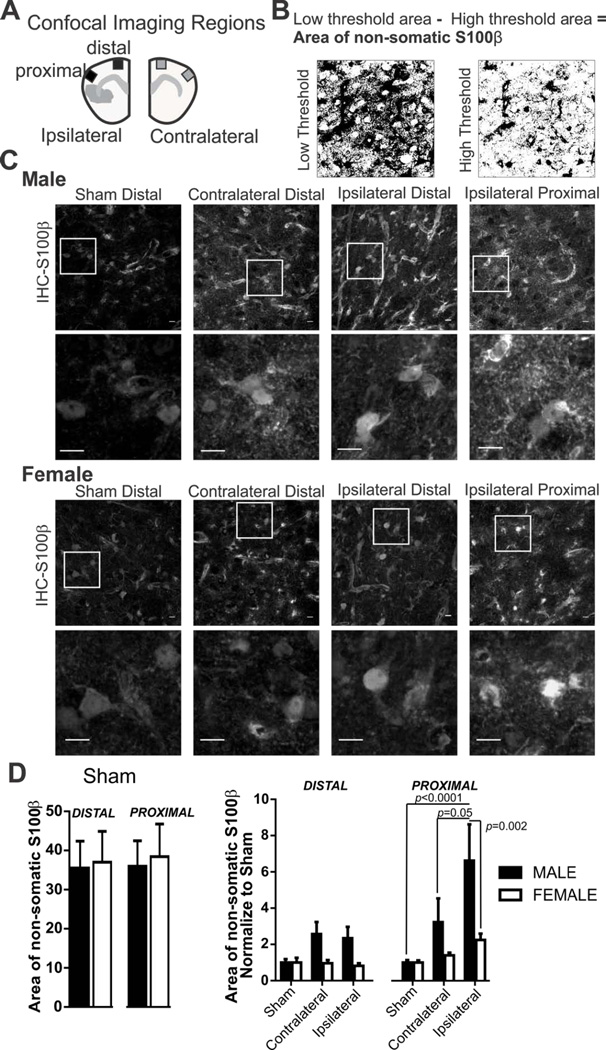
Figure 3. Sex differences in S100β expression pattern after 60 min MCA occlusion.
A) Schematic drawing depicting regions imaged within cortical layers I–III in matching ipsilateral and contralateral brain sides with corresponding proximal and distal regions relative to the ischemic region. B) Example of high and low threshold binary images used to calculate non-somatic S100β. C) S100β immunostaining in male and female tissue after 60 MCA occlusion in sham, contralateral, and ipsilateral (distal and proximal) brain regions. Cropped photomicrographs corresponding to highlighted square shown in first row illustrate additional detail of somatic and non-somatic immunofluorescence. All data was collected using full sized photomicrographs (Scale bars = 10µm). D) Summary data of non-somatic S100β after sham procedure (left) and after 60 min MCA occlusion (right) in male and female mice. N (male/female animals): Distal: Sham (9/6), contralateral (9/8), ipsilateral (9/8); Proximal: Sham (9/6), contralateral (9/8), ipsilateral (9/8). Non-somatic S100β in male and female sham mice (mean and SEM) are compared using an unpaired Student’s t-test: distal p = 0.89; proximal, p = 0.81. Non-somatic S100β after 60min MCA occlusion in male and female mice (mean and SEM) are compared using two-way ANOVA: region, p= 0.0007, sex, p= 0.0019, interaction: p= 0.12 with Sidak multiple comparison analysis is reported in the figure.

