
Figure 2.
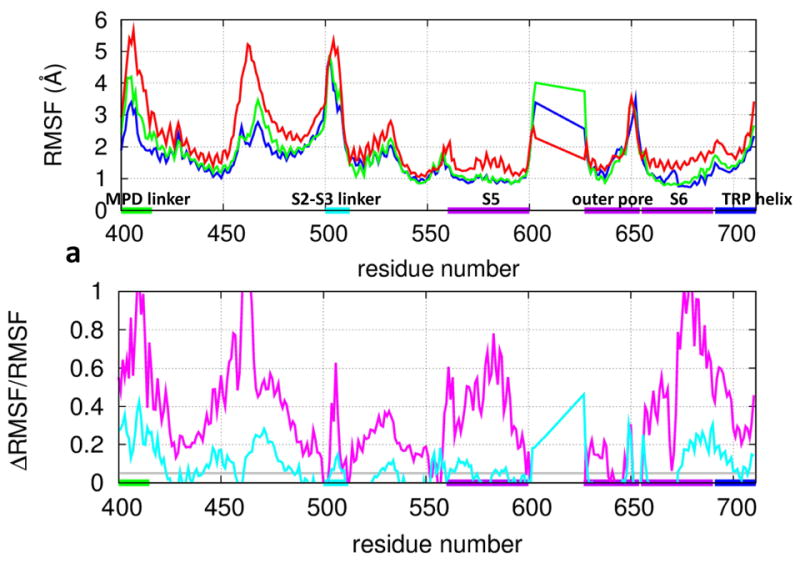
Results of RMSF analysis for TRPV1: (a) RMSF at individual residue positions in the expanded TMD (blue: the C state at 30°C, green: the heated C state at 60°C, red: the O state at 60°C). (b) The fractional RMSF changes (purple: from the C state to the O state, cyan: from the C state to the heated C state). The average RMSFn for four equivalent residue positions n of the TRPV1 tetramer is shown. The residue positions corresponding to the MPD linker, the S2-S3 linker, the S5 and S6 helices, the outer pore, and the TRP helix are marked by horizontal bars (same color coding as Fig 1a).