
Figure 3.
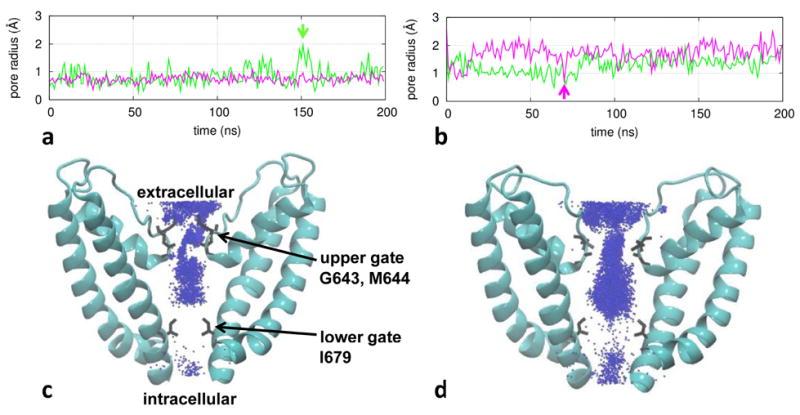
Results of channel pore analysis for TRPV1: (a) pore radius at the upper gate (green) and the lower gate (purple) as a function of time for a representative trajectory in the C state at 30°C; (b) pore radius for a representative trajectory in the O state at 60°C; (c) a density map of K+ ions for the C-state ensemble; (d) a density map of K+ ions for the O-state ensemble. In (a) and (b), two snapshots with transient upper-gate opening and lower-gate closing are marked by vertical arrows. In (c) and (d), two diagonally opposing subunits are shown with gate residues G643, M644, and I679 labeled, and K+ ions are depicted as blue points.