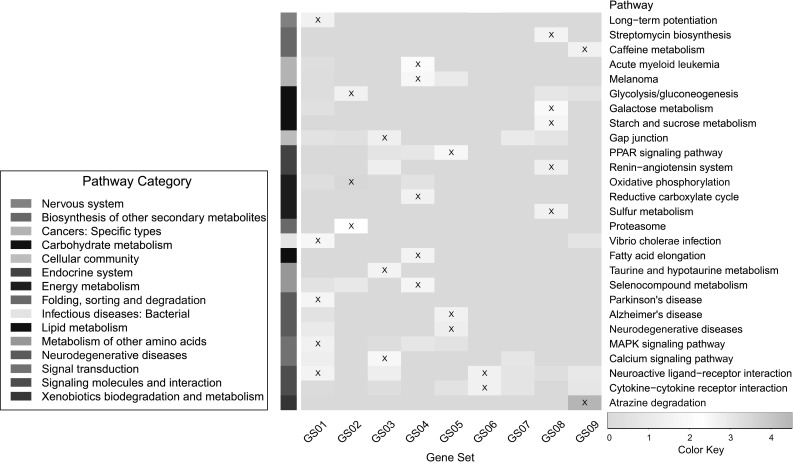
Fig. 5.

Results of KEGG pathway enrichment for identified GSs. The x axis represents unique GS ID, and y axis represents −log p value of enrichment significance of KEGG pathways. Marked cell represents significant enrichment (p value )

Results of KEGG pathway enrichment for identified GSs. The x axis represents unique GS ID, and y axis represents −log p value of enrichment significance of KEGG pathways. Marked cell represents significant enrichment (p value )