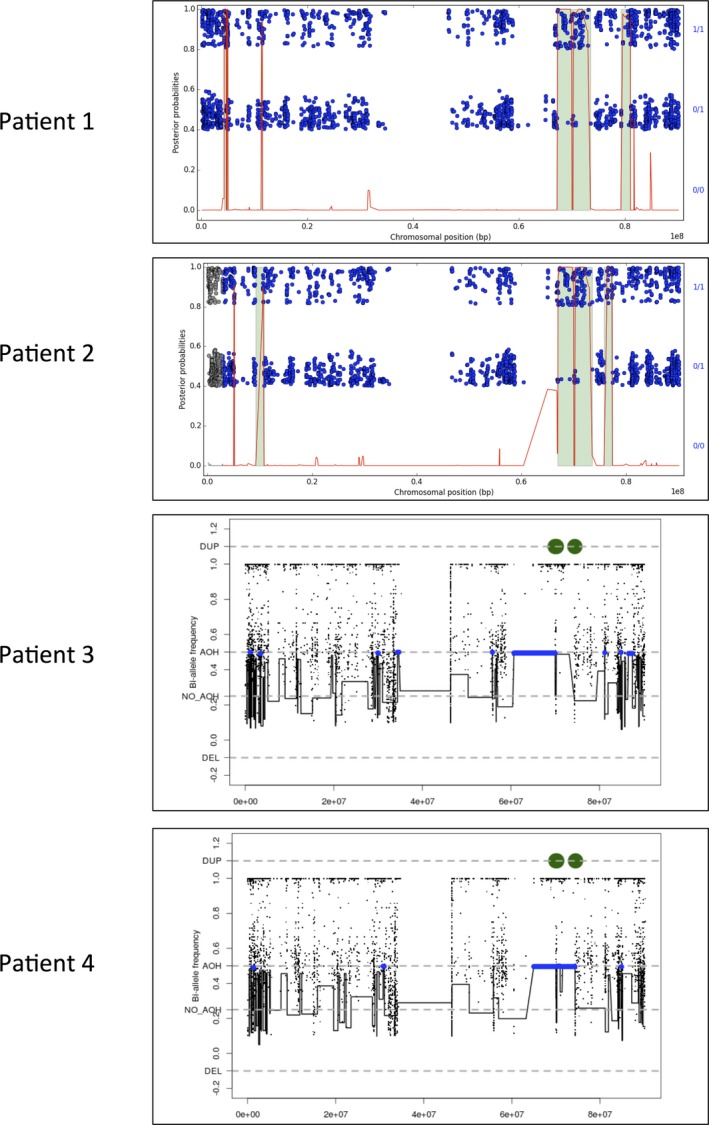
Figure 2.

Autozygosity mapping of chromosome 16, based on the exome sequencing results for patients #1 and 2, and SNP array for patients #3 and 4. For patients #1 and 2, the plots were made in FILTUS, and show the posterior autozygosity probability for each variant against its chromosomal position (red curve). Regions called as autozygous are marked in green. Single variants are shown as blue dots: homozygous variants in the upper band; heterozygous in the lower. For patients #3 and 4, autozygosity mapping was performed using exome data. Regions called as autozygous are marked in blue.
