Fig. 3.
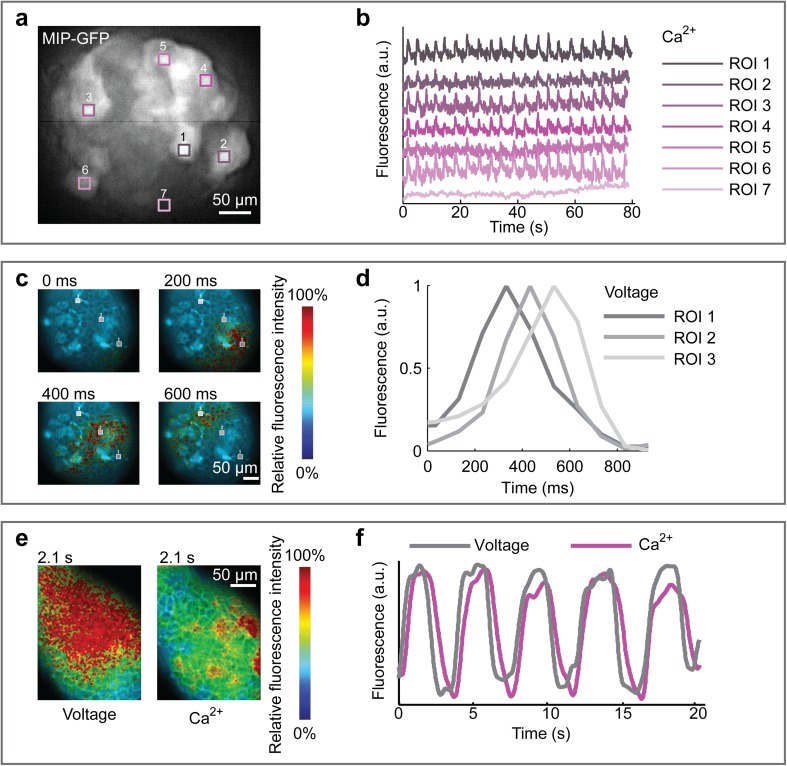
Validation of islet functional response at 11 mM glucose. a Green fluorescence intensity of an islet isolated from a Mouse Insulin Promoter (MIP)-GFP mouse, pre-loaded with Fura Red for intracellular Ca2+ detection. b Plots of synchronous intracellular Ca2+ oscillations of cells in the regions of interest (ROIs) indicated in a. ROI 7 refers to non β-cells (GFP-), which do not show Ca2+ oscillatory activity in response to high glucose concentration. c Membrane potential of an islet from a wild-type mouse loaded with the voltage dye Vf2.1.Cl and imaged at the indicated time points during constant perfusion at high glucose. The false-colored image sequence shows fluorescence intensity. d Plot of signal intensity inside ROIs indicated in c. Oscillation phase shift describes the spatial propagation of electrical activity from cell to cell within the islet (see also Video 2). e Simultaneous recording of intracellular Ca2+ and membrane potential in an islet from a wild-type mouse, pre-loaded with Fura Red and Vf2.1.Cl. The false-colored image sequence shows fluorescence intensity. f Plot derived from data shown in e. Intracellular Ca2+ and membrane potential waves propagate with the same periodicity. Ca2+ propagation occurs with slightly delayed phase (see also Video 3)

