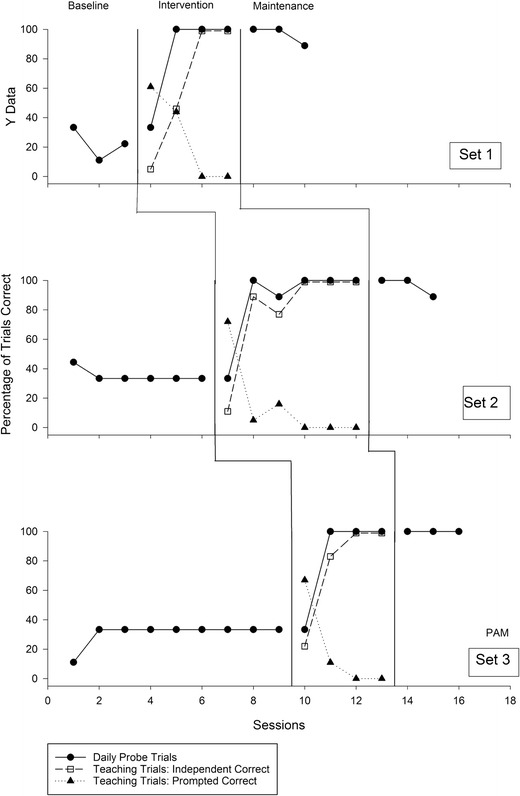
Fig. 4.

Closed circles indicate the percentage of trials with correct responses during daily probe sessions; open squares and closed triangles indicate the percentage of trials with independent and prompted correct responses during teaching sessions, respectively
