
FIGURE 4.
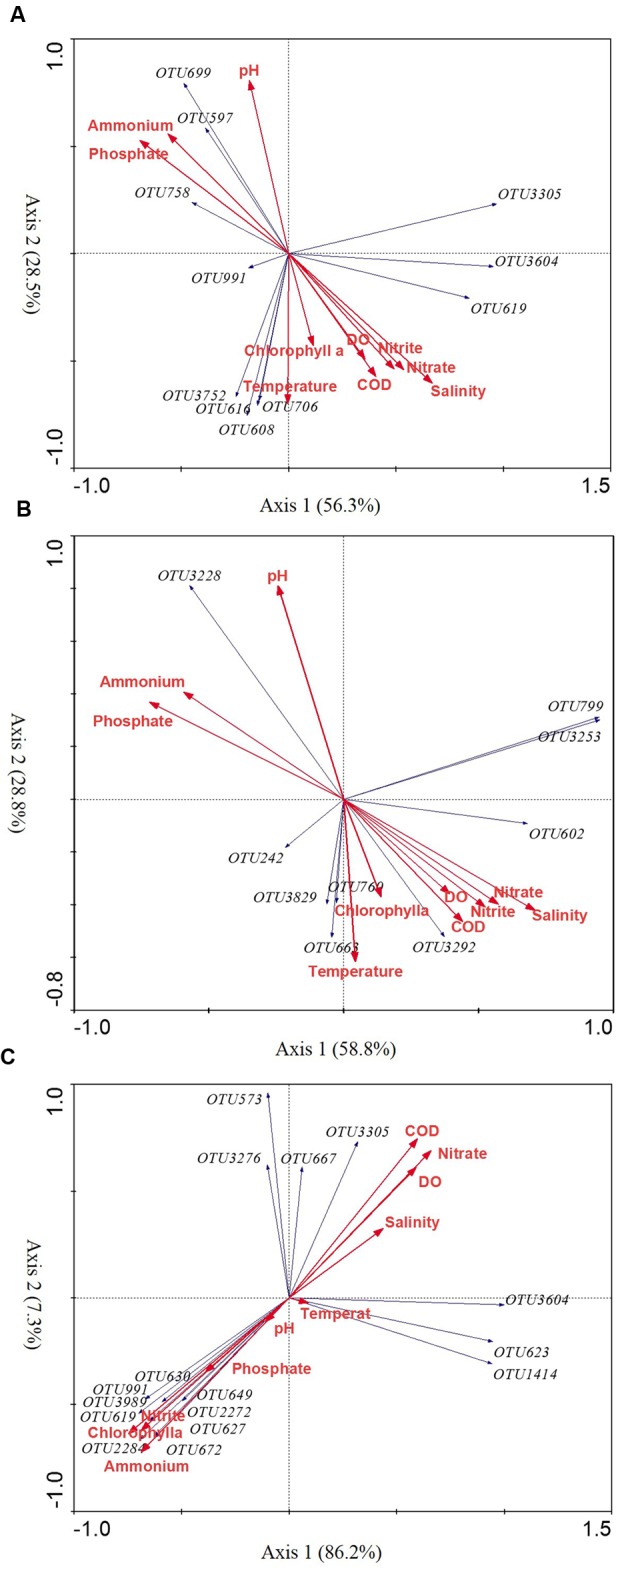
The redundancy analysis (RDA) ordination biplot showing the relationship between environmental variables and significantly seasonal variable OTUs in G. astreata (A), P. decussata (B), and P. lutea (C) samples. Only abundant variable OTUs (1%) are shown in the biplot.