
FIGURE 6.
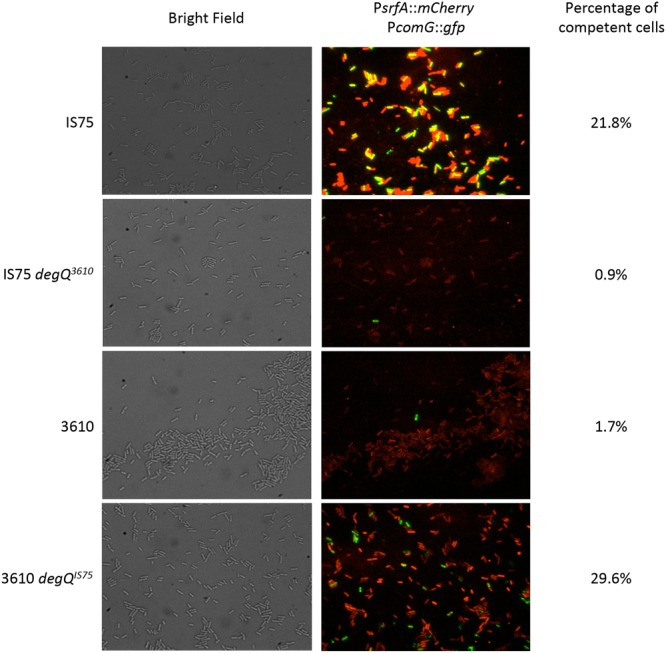
Single-cell expression of PsrfA-mCherry and PcomG-gfp. The indicated strains, all of which carried these two fusion constructs, were grown to the time of maximum K-state expression and samples were taken for microscopy. Representative images are shown. The 3610 and IS75 degQ3610 images were selected to include at least one K-state cell each. On the right are the percentages of K-state cells determined by examining at least 1200 cells for each strain. Strain numbers are presented in Supplementary Table S1.