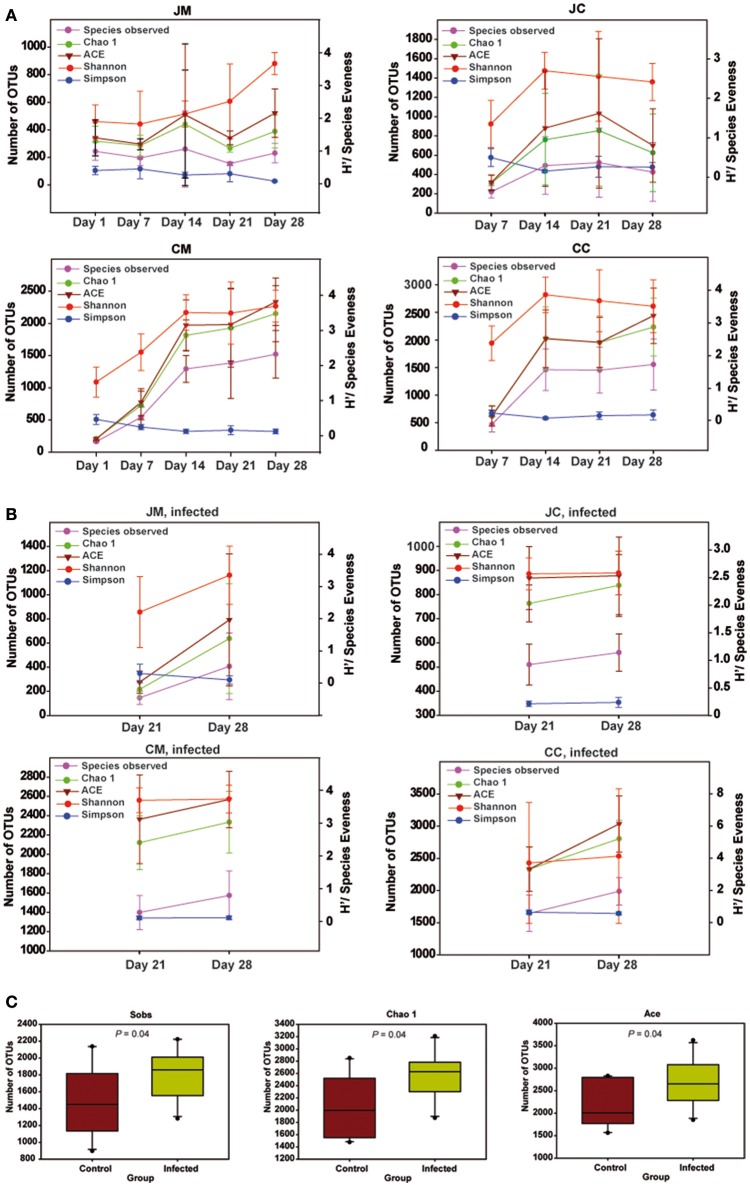
Figure 4.
Species richness and diversity measures of the microbial community at all gut sites in the control (A), infected birds (B), and (C) species richness and diversity estimates for bacteria from cecum content of the infected birds compared with the controls. Left Y-axis for number of observed OTUs (Sobs), Chao 1 and ACE, and Right Y-axis for Shannon and Simpson. Significant differences were calculated with Kruskal-Wallis-tests and Mann-Whitney-tests, and significance was declared at P < 0.05. Data are presented as the mean values and SD. JM, jejunal mucosa; JC, jejunal content; CM, cecum mucosa; CC, cecum content.

