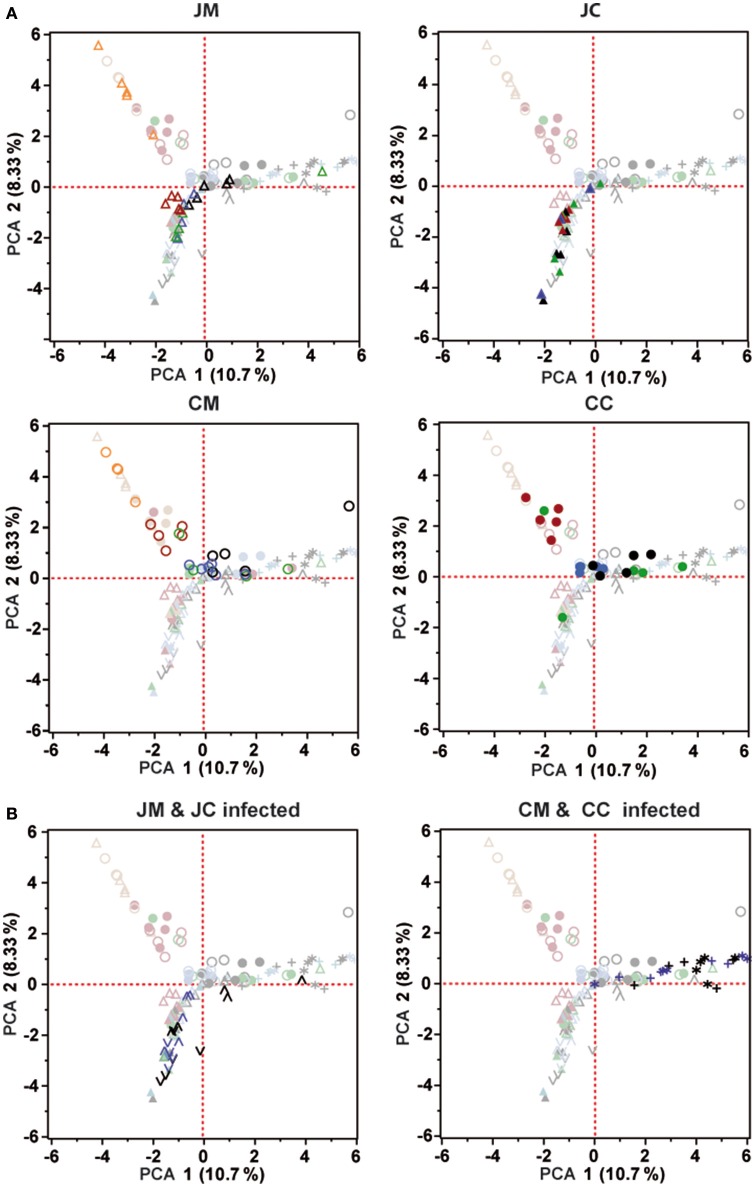
Figure 6.
Principal component analysis (PCA) was analyzed for the control (A) and infected birds (B). Orange (day 1), Red (day 7), Green (day 14), Blue (day 21), and Black (day 28). Each symbol indicates an individual bird. All PCA plots include the data of all samples; symbols not belonging to the sample group indicated in the header are displayed faded. JM, jejunal mucosa; JC, jejunal content; CM, cecum mucosa; CC, cecum content.

