Figure 1.
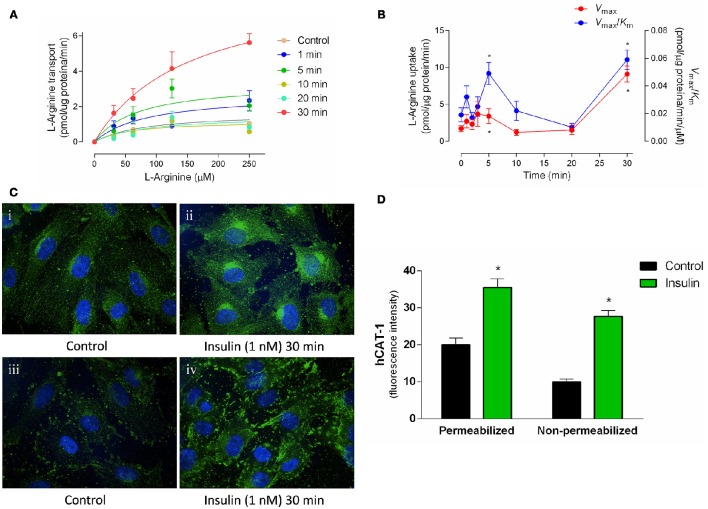
Insulin induces rapid increases in the hCAT-1 activity. L-Arginine transport (0–250 μmol/L L-arginine, 2 μCi/mL L-[3H]arginine, 1 min, 37°C) and hCAT-1 expression were determined in HUVECs pre-incubated (1–30 min) in medium 199 in absence (control) or presence of 1 nM insulin. Saturable transport was adjusted to Michaelis-Menten kinetic curve (A) and maximal velocity (Vmax) and maximal transport capacity (Vmax/Km) values were plotted and calculated from experimental data (B). hCAT-1 expression was determined through immunocytochemistry (green fluorescence) in permeabilized (Ci; Cii) or non-permeabilized (Ciii; Civ) cells. Control cells are in the absence of insulin. Images were obtained with 60x magnification in confocal microscopy. (D) Mean fluorescence intensity was determined based on cells volume of three different fields of each experiment and values in y-axis are presented as arbitrary units. *P < 0.05 vs. values in the absence of insulin. In (A,B), values are mean ± S.E.M. (n = 12–15). In (C), images are representative of three different cell cultures and graph (D) shows mean ± S.E.M. (n = 3).

