Figure 1.

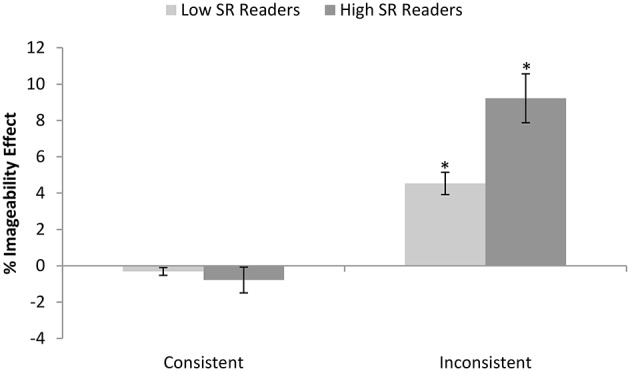
Percentage imageability effect seen in error rates for each reader group (high vs. low semantic reliance) according to consistency. Error bars represent standard error. Asterisks indicate significant imageability effects of p < 0.0005.

Percentage imageability effect seen in error rates for each reader group (high vs. low semantic reliance) according to consistency. Error bars represent standard error. Asterisks indicate significant imageability effects of p < 0.0005.