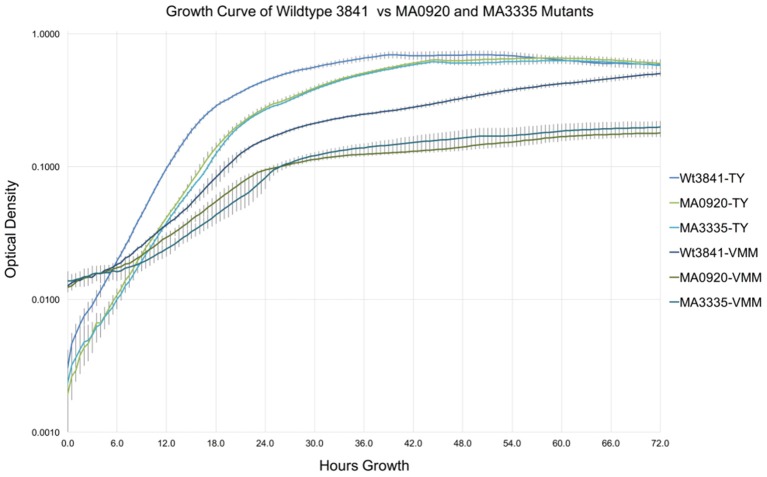
Figure 3.
Growth curve comparison of RLV3841, MA0920, and MA3335 in TY and VMM. Growth curves represent the mean OD600 of 7 replicates measured at 30 min intervals over 72 h in TY and VMM-Mannitol liquid growth media; error bars indicate the standard deviation of the mean. MA0920 and MA3335 had longer mean generation times than the wildtype in TY and VMM-mannitol. After 72 h of growth in VMM-mannitol, MA0920, and MA3335 reached cell densities that were ~1/3 of the wildtype.

