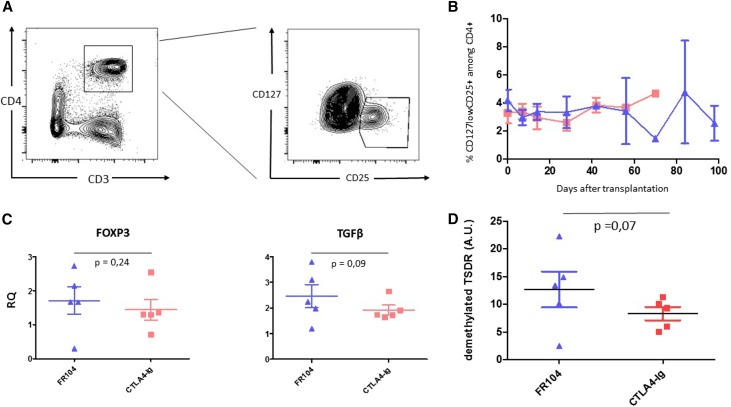
Figure 3.
Assessment of TSDR methylation status reveal a nonsignificant trend for higher regulatory T cell frequencies in FR104-treated animals. (A) Flow cytometry contour plot showing gates used to assess percentage of CD4+CD25hiCD127low Treg cells. (B) Kinetics of Treg cells post-transplantation in FR104-treated recipients (blue triangles; n=5) and belatacept-treated recipients (red squares; n=5). (C) Quantitative real–time PCR measurement of Foxp3 and TGFβ gene expression in 1-month protocol biopsies or earlier biopsies in cases of rejection from animals treated with FR104 (blue triangles; n=5) or belatacept (red squares; n=5). (D) TSDR analysis in 1-month protocol biopsies or earlier biopsies in cases of rejection from animals treated with FR104 ((blue triangles; n=5) or belatacept (red squares; n=5) ; data are means±SEMs. Graph shows gene expression relative to HPRT; data are means±SEMs.

