Figure 4.
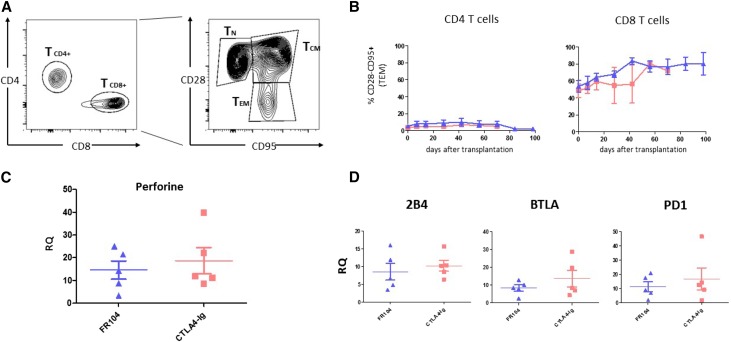
CD28 negative T cells and the co-inhibitory receptor 2B4 are not differentially regulated between the FR104 group and the belatacept group. (A) Flow cytometry contour plot showing gates used to assess percentage of naïve T cells (TNs; CD28+CD95−), central memory T cells (TCMs; CD28+CD95+), and effector memory T cells (TEMs; CD28−CD95+) among CD4+ and CD8+. (B) Kinetics of the CD4+ and CD8+ compartments of TEMs post-transplantation in FR104-treated recipients (blue triangles; n=5) and belatacept-treated recipients (red squares; n=5). (C and D) Quantitative real–time PCR measurement of gene expression in 1-month protocol biopsies (or earlier in cases of rejection) from animals treated with FR104 (blue triangles; n=5) or belatacept (red squares; n=5). Graph shows gene expression relative to HPRT; data are means±SEMs.

