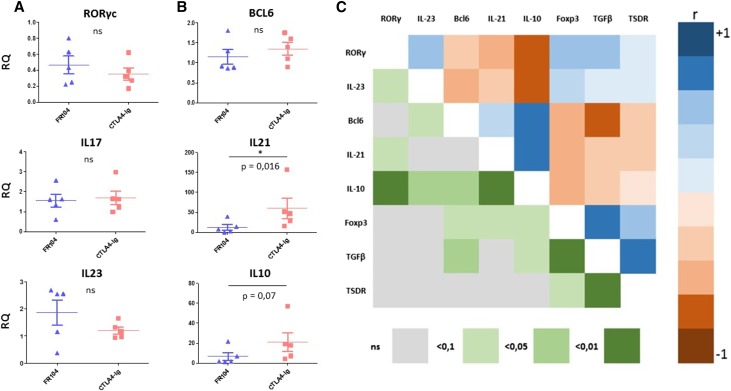
Figure 5.
The IL-21 gene expression but not the Th17 gene expression signature is increased in belatacept-treated recipients. (A and B) Quantitative PCR measurement of mRNA expression on 1-month protocol biopsies (or earlier in cases of rejection) from animals treated with FR104 (blue triangles; n=5) or belatacept (red squares; n=5). Gene expression is relative to HPRT. Data are means±SEMs. A Mann–Whitney nonparametric test was used, and P values <0.05 were considered significant. (C) Pairwise correlation analysis to determine the direction and strength of the linear relationships between genes. The upper right of the matrix is the color map of correlations. Bright colors indicate the pairs of variables closely related using the Spearman rank correlation coefficient (r), and faded colors encode for decreasing r values. The lower left of the matrix is the color map of P values.

