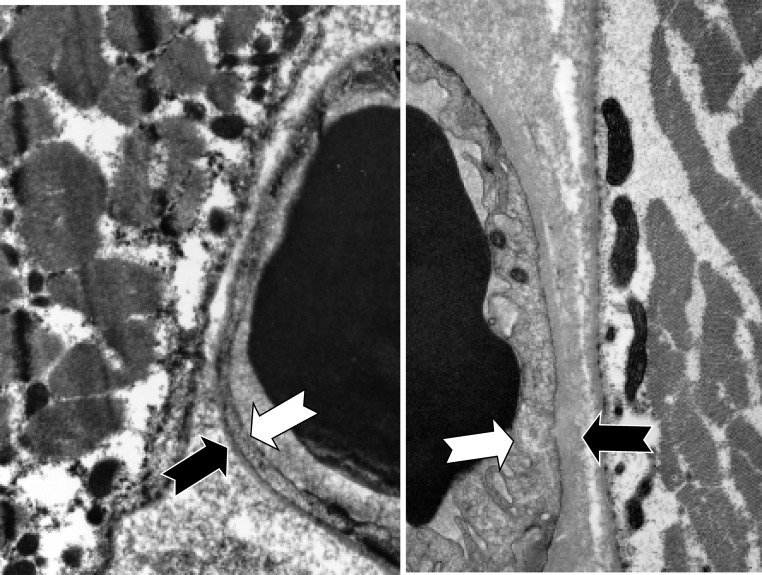
Figure 3.
Comparison of representative hemodialysis patient and healthy control electron micrograph of capillary and skeletal muscle. The photo in the left panel is from an individual without renal failure, and the photo in the right panel is from a patient on hemodialysis. The large black objects on the inner edges of the two photographs are red blood cells in capillaries. The white arrows depict the inner edges of the capillary endothelium, and the black arrows depict the outer edges of the capillary basement membrane. Magnification, ×5000.

