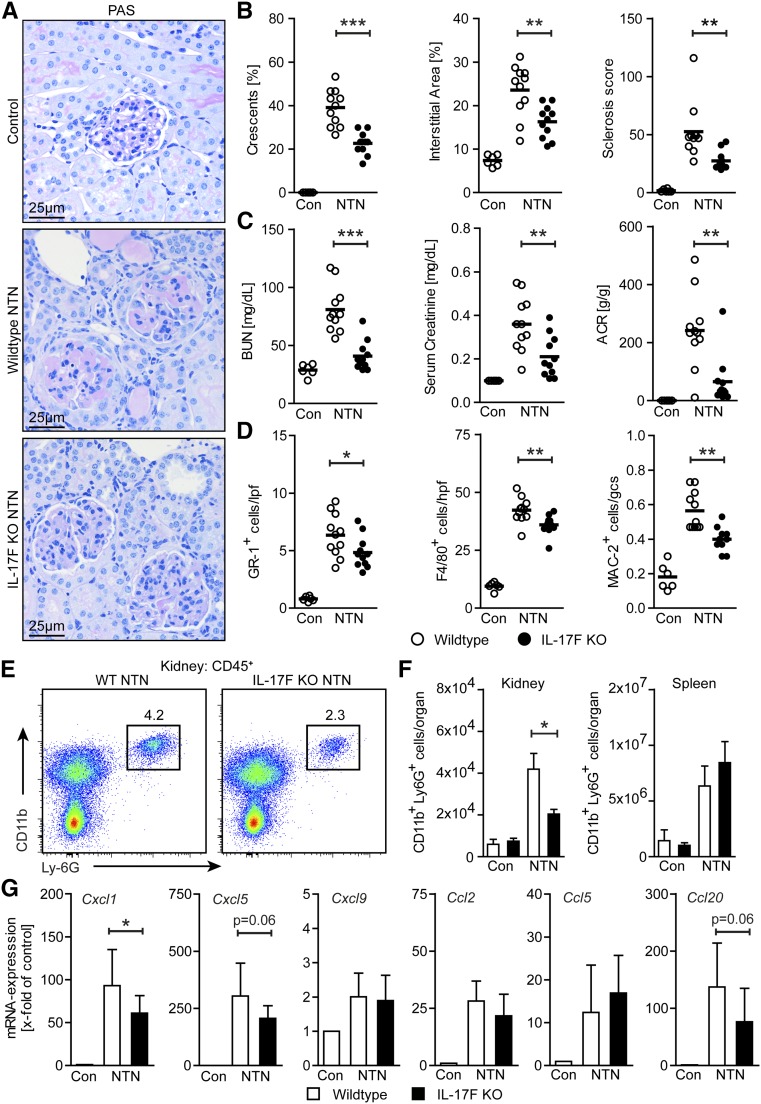
Figure 2.
IL-17F drives renal tissue injury by mediating neutrophil infiltration. (A) Representative photographs of PAS-stained kidney sections from control, nephritic wild-type, and nephritic IL-17F–deficient mice at day 8 of NTN (original magnification ×400). (B) Quantification of glomerular crescent formation, interstitial area, and glomerular sclerosis of controls (n=6), nephritic wild-type (n=11), and nephritic IL-17F–deficient mice (n=11) 8 days after induction of nephritis. (C) BUN levels, serum creatinine, and ACR of the aforementioned groups 8 days after induction of nephritis. (D) Quantification of tubulointerstitial GR-1+ cells, F4/80+ cells, and glomerular MAC-2+ cells in the aforementioned groups 8 days after induction of nephritis. (E) Representative FACS plots showing renal neutrophils (defined as CD45+CD11b+Ly6G+ cells) in nephritic wild-type and nephritic IL-17F–deficient mice and (F) quantification of FACS analysis of renal and splenic neutrophils of wild-type controls (n=3–4), IL-17F–deficient controls (n=3–4), nephritic wild-type (n=5), and nephritic IL-17F–deficient mice (n=4) at day 8 of NTN. (G) Real-time RT-PCR analyses of renal mRNA expression of different chemokines of controls (n=6), nephritic wild-type (n=11), and nephritic IL-17F–deficient mice (n=11) 8 days after induction of nephritis. mRNA levels are expressed as x-fold of controls. Symbols represent individual data points with the mean as horizontal line, or bar graphs with the mean±SD. *P<0.05; **P<0.01; ***P<0.001.

