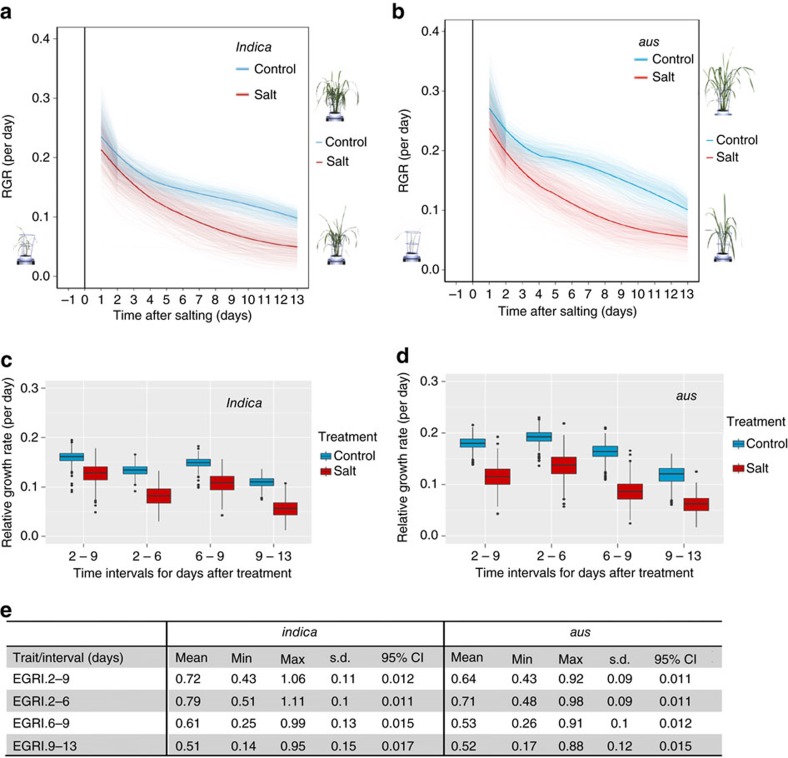
Figure 1. Relative growth rate (RGR) of salinity-induced responses comparing indica and aus.
(a) Smoothed RGR values were obtained from projected shoot area (PSA) values to which splines had been fitted, as shown in Supplementary Fig. 2. This was applied to the data from individual indica and (b) aus plants. The solid line represents the grand average of control conditions (blue) and saline conditions (red). In each panel, the RGB image of a rice plant on the left is representative of a plant 1 day before salt application. The RGB image on the top right side represents the same plant after 13 days of salt treatment, while the RGB image on the bottom right represents the same plant genotype at 13 days under control conditions. (c) Values of RGR at different time intervals for indica (n=528; partially replicated; median=0.13, 0.15, 0.11 and 0.10 for intervals: 2–9, 2–6, 6–9 and 9–13 days after salting, respectively) and (d) Values of RGR at different time intervals for aus (n=226; fully replicated; median=0.15, 0.17, 0.13 and 0.09 for intervals: 2–9, 2–6, 6–9 and 9–13 days after salting, respectively). (e) Table comparing the mean early growth response index (EGRI) at different time intervals for indica and aus. Min and max refer to the minimum and maximum means, respectively. s.d. refers to standard deviation. CI, confidence interval.

