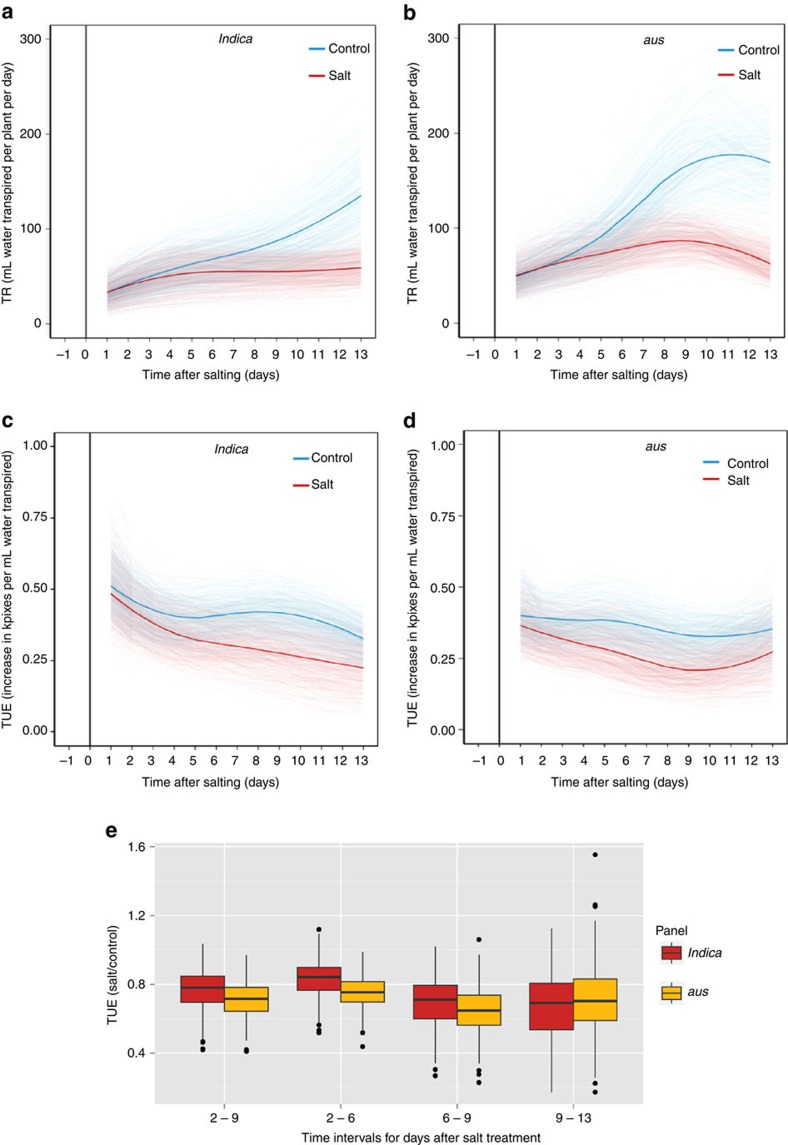
Figure 2. Transpiration of salinity-induced responses comparing indica and aus.
Spline curve fits of transpiration rate (TR) through time for individual (a) indica and (b) aus plants and transpiration use efficiency (TUE) through time for individual (c) indica and (d) aus plants. The solid blue lines represent the grand average spline in control conditions and the solid red lines represent the same in saline conditions. (e) Box plots of the TUE salinity tolerance index (salt/control), comparing indica (n=528; partially replicated; median=0.78, 0.84, 0.71 and 0.69 for intervals: 2–9, 2–6, 6–9 and 9–13, respectively) and aus (n=226; fully replicated; median=0.71, 0.75, 0.64 and 0.70 for intervals: 2–9, 2–6, 6–9 and 9–13 days after salting, respectively).

