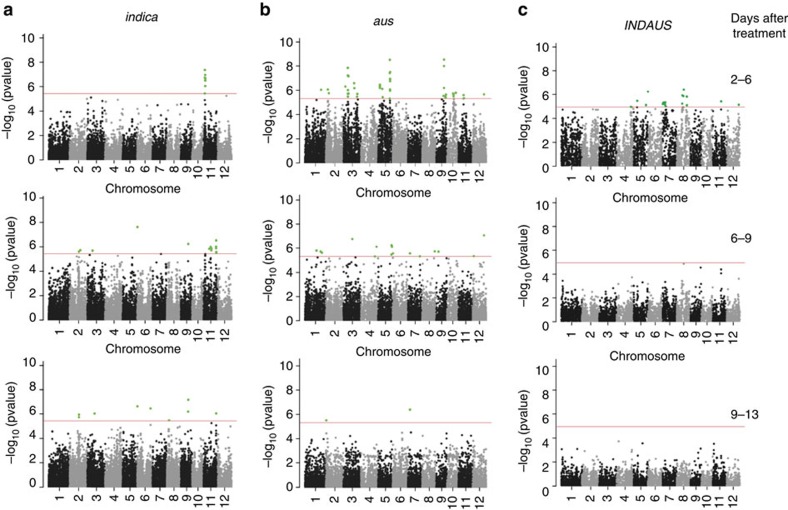
Figure 3. Marker-by-treatment interaction model using transpiration use efficiency in response to salinity.
SNPs are highlighted in green if they reach genome-wide significance for association with TUE at each time interval in (a) indica, (b) aus and (c) INDAUS. SNPs associated with TUE are shown at the different time intervals: 2–6, 6–9 and 9–13 days after treatment (panels top to bottom). Horizontal red lines indicate Bonferroni-adjusted threshold of α=0.05, which corresponded to P=8.99 × 10⁻⁶, 2.57 × 10⁻⁶ and 3.02 × 10⁻⁶ for the INDAUS, indica and aus subpopulations, respectively.

